Climate Change, Energy Use and Health of India: Through the data lens
Climate Change, Energy Use and Health of India: Through the data lens
Published on :- September 17th, 2021
"As we witness our planet transforming around us we watch, listen, measure … respond." – 2021 Alisa Singer [1]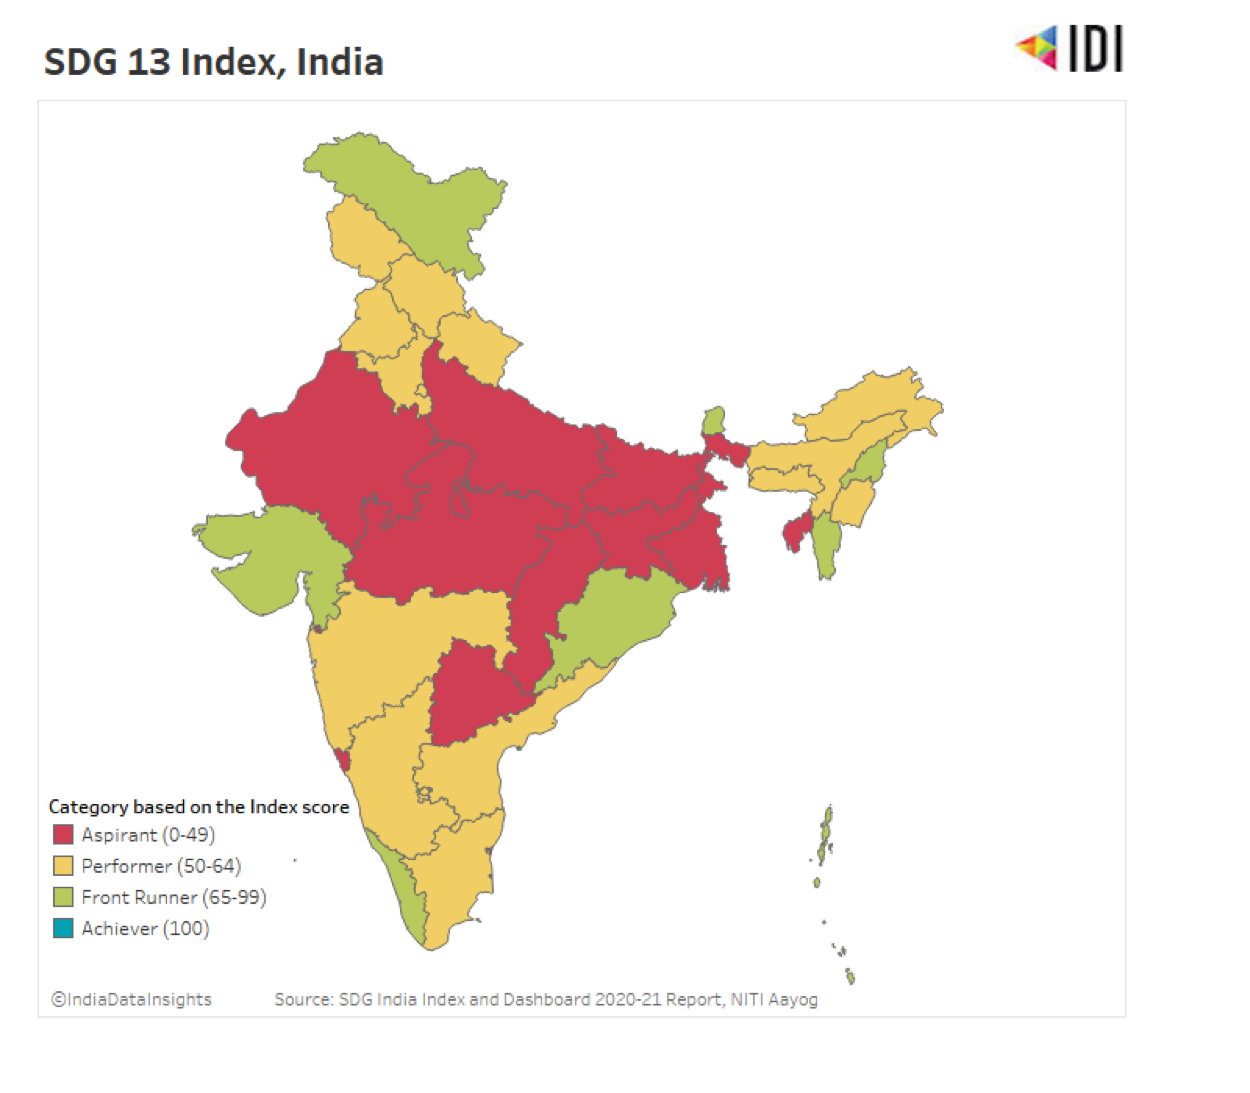 Climate Change is a notable and emerging threat for developing countries like India. The United Nations has defined SDG Goal 13 as “ Take urgent action to combat climate change and its impacts.”
In order to capture India’s performance towards the Goal of Climate Action, five national level indicators have been identified in the SDG India Index and Dashboard 2020-21 Report by NITI Aayog, namely, number of human lives lost per 1 crore population due to extreme weather events, Disaster preparedness score as per Disaster Resilience Index, Percentage of renewable energy out of total installed generating capacity (including allocated shares), CO2 saved from LED bulbs per 1,000 population (Tonnes) and Disability Adjusted Life Years (DALY) rate attributable to air pollution (per 1,00,000 population).
Accordingly, an SDG 13 score is calculated for each state and UT for India which shows where each state, UT and thus, India as a whole, stands towards achieving sustainability in climate change and strengthening energy efficiency, resilience and adaptive capacity to climate-related hazards and natural disasters through strategic planning and national policies. On average India’s Climate Action SDG score is at 54 and comes under the ‘Performer’ status. While there are no states that have reached the ‘Achiever’ status, there are quite a few states that are ‘Front Runners’ where Odisha is at the top at 77 followed by Kerala and Nagaland at 69. Gujarat is also a Front Runner at 67. Among UTs, Andaman & Nicobar Islands score a 77 followed by Lakshadweep at 68 and are Front Runners. While states and UTs in yellow have been performing well, the ones in red are highlighted as ‘Aspirants’ and would require undertaking some steps towards effective climate change related planning and management.
Climate Change is a notable and emerging threat for developing countries like India. The United Nations has defined SDG Goal 13 as “ Take urgent action to combat climate change and its impacts.”
In order to capture India’s performance towards the Goal of Climate Action, five national level indicators have been identified in the SDG India Index and Dashboard 2020-21 Report by NITI Aayog, namely, number of human lives lost per 1 crore population due to extreme weather events, Disaster preparedness score as per Disaster Resilience Index, Percentage of renewable energy out of total installed generating capacity (including allocated shares), CO2 saved from LED bulbs per 1,000 population (Tonnes) and Disability Adjusted Life Years (DALY) rate attributable to air pollution (per 1,00,000 population).
Accordingly, an SDG 13 score is calculated for each state and UT for India which shows where each state, UT and thus, India as a whole, stands towards achieving sustainability in climate change and strengthening energy efficiency, resilience and adaptive capacity to climate-related hazards and natural disasters through strategic planning and national policies. On average India’s Climate Action SDG score is at 54 and comes under the ‘Performer’ status. While there are no states that have reached the ‘Achiever’ status, there are quite a few states that are ‘Front Runners’ where Odisha is at the top at 77 followed by Kerala and Nagaland at 69. Gujarat is also a Front Runner at 67. Among UTs, Andaman & Nicobar Islands score a 77 followed by Lakshadweep at 68 and are Front Runners. While states and UTs in yellow have been performing well, the ones in red are highlighted as ‘Aspirants’ and would require undertaking some steps towards effective climate change related planning and management.
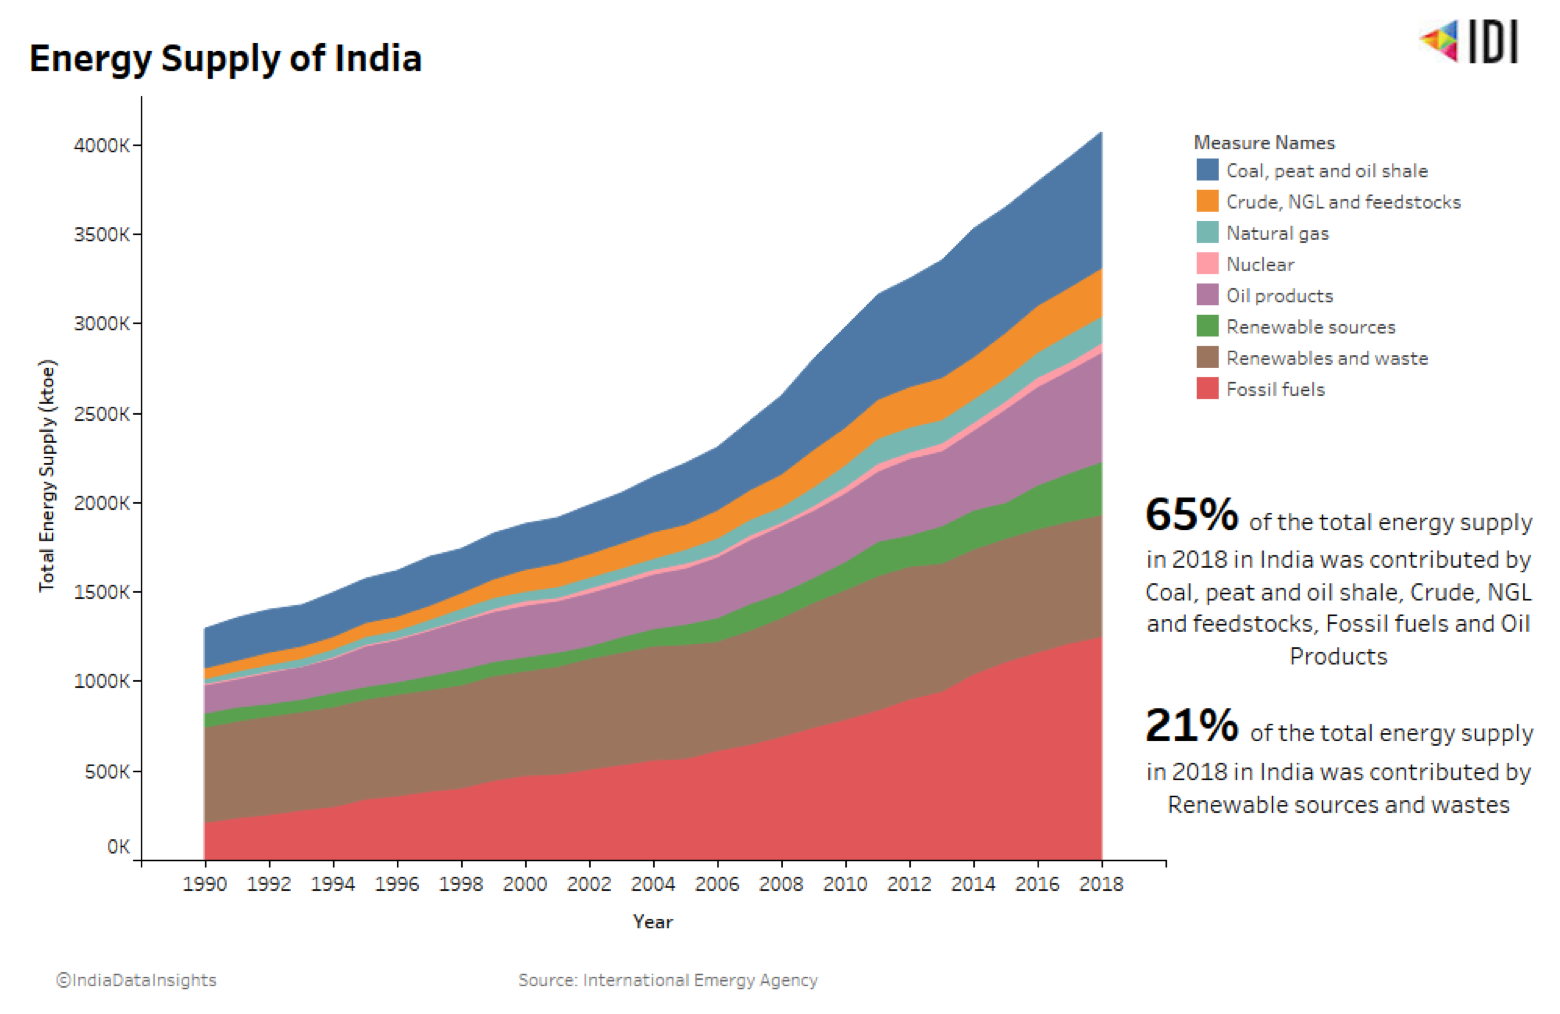 Energy has been a major enabler for development starting from the early use of wood fire and animal power to the use of coal, oil, fossil fuels and evolving renewable sources. India is home to some of the largest coal reserves in the world. Total estimated reserves of coal in 2020 were 344.02 billion tonnes with a growth of 5.37% between 2019 and 2020. [2]
65% of the total energy supply in 2018 in India was contributed by coal, peat and oil shale, crude, NGL and feedstocks, fossil fuels and oil products. [3]
Since 1990, Coal reserves, oil products and fossil fuels have been dominating India's energy mix. Deep in the state of Chhattisgarh in a district named Korba is the largest open-pit coal mine and a dozen coal power plants. Alongwith Chhattisgarh, Jharkhand and Odisha add in to account for approximately 70% [4] of the coal reserves in the country where fires burn 24/7 and power the livelihoods of many people. However, it is gradually affecting their health through the massive emissions of greenhouse gases in the air. India’s dangerous addiction to fossil fuels has also played its part in contributing to the degrading levels of pollution in the country.
Energy has been a major enabler for development starting from the early use of wood fire and animal power to the use of coal, oil, fossil fuels and evolving renewable sources. India is home to some of the largest coal reserves in the world. Total estimated reserves of coal in 2020 were 344.02 billion tonnes with a growth of 5.37% between 2019 and 2020. [2]
65% of the total energy supply in 2018 in India was contributed by coal, peat and oil shale, crude, NGL and feedstocks, fossil fuels and oil products. [3]
Since 1990, Coal reserves, oil products and fossil fuels have been dominating India's energy mix. Deep in the state of Chhattisgarh in a district named Korba is the largest open-pit coal mine and a dozen coal power plants. Alongwith Chhattisgarh, Jharkhand and Odisha add in to account for approximately 70% [4] of the coal reserves in the country where fires burn 24/7 and power the livelihoods of many people. However, it is gradually affecting their health through the massive emissions of greenhouse gases in the air. India’s dangerous addiction to fossil fuels has also played its part in contributing to the degrading levels of pollution in the country.
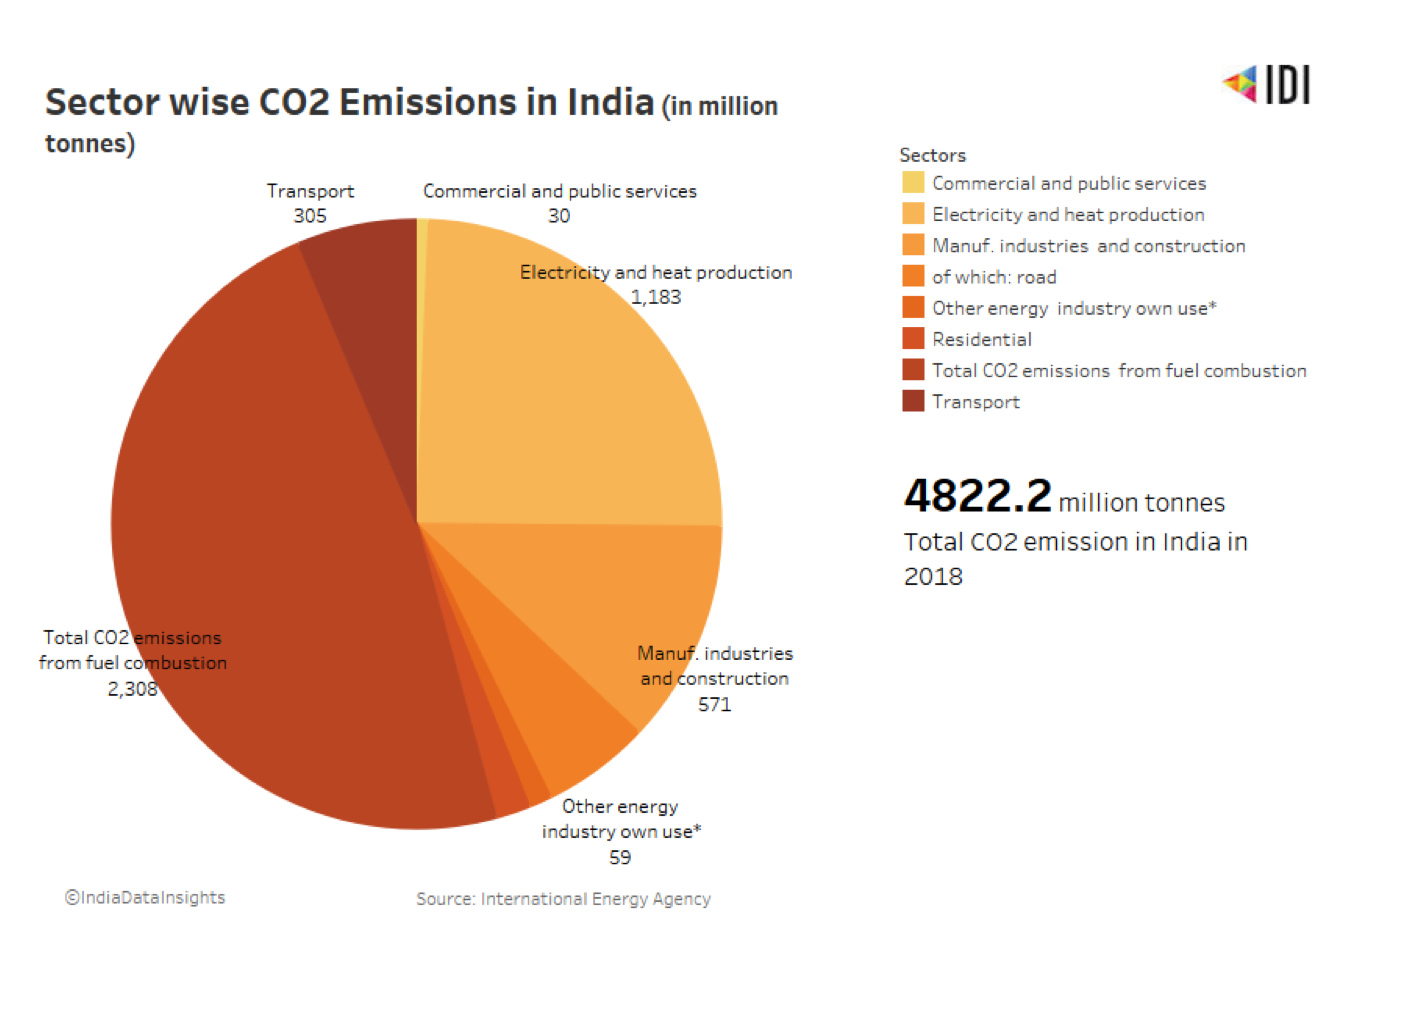 Carbon Dioxide which forms a major composition of the greenhouse gases has accounted for 4,822.19 million tonnes of emission in India alone in 2018. 48% of the carbon dioxide emissions come from fuel combustion. [5]
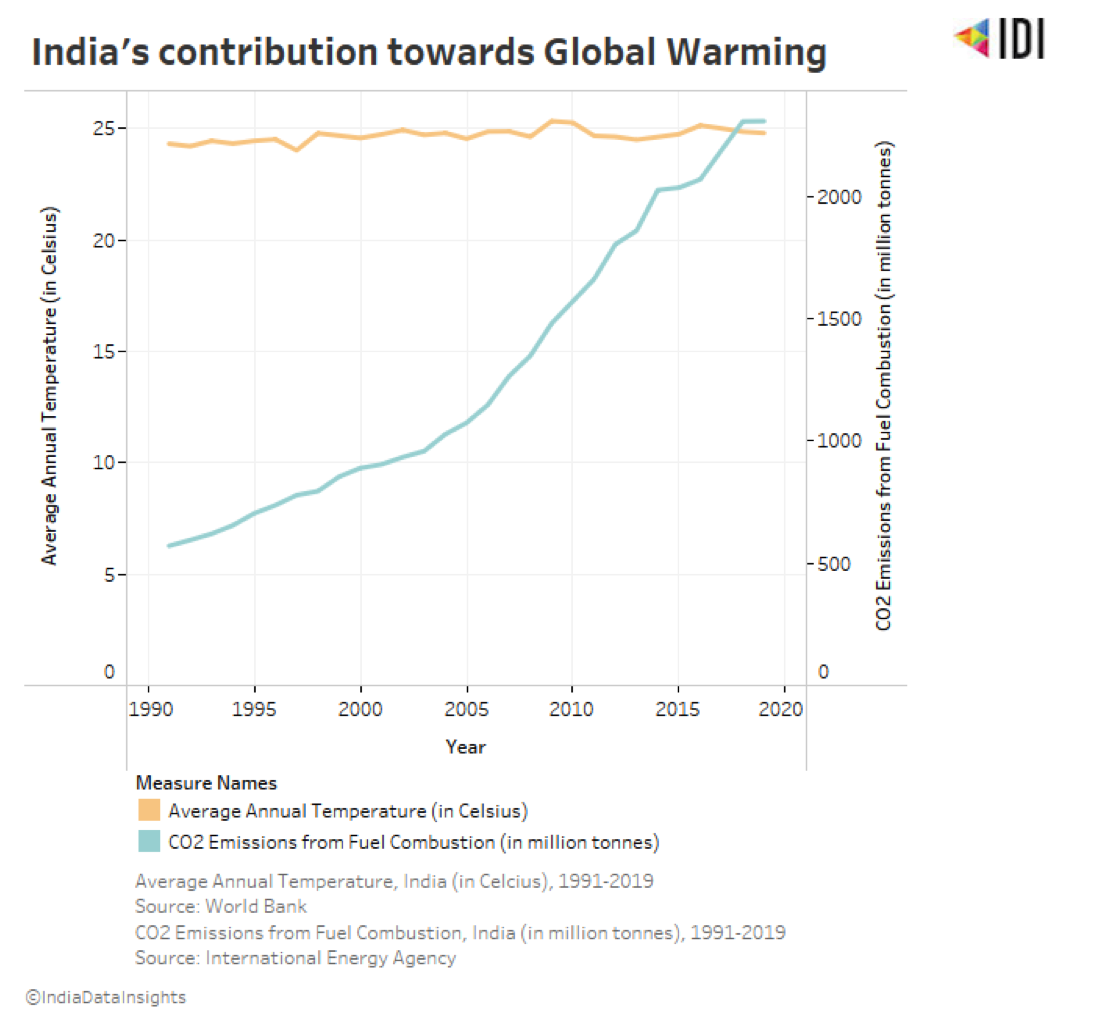
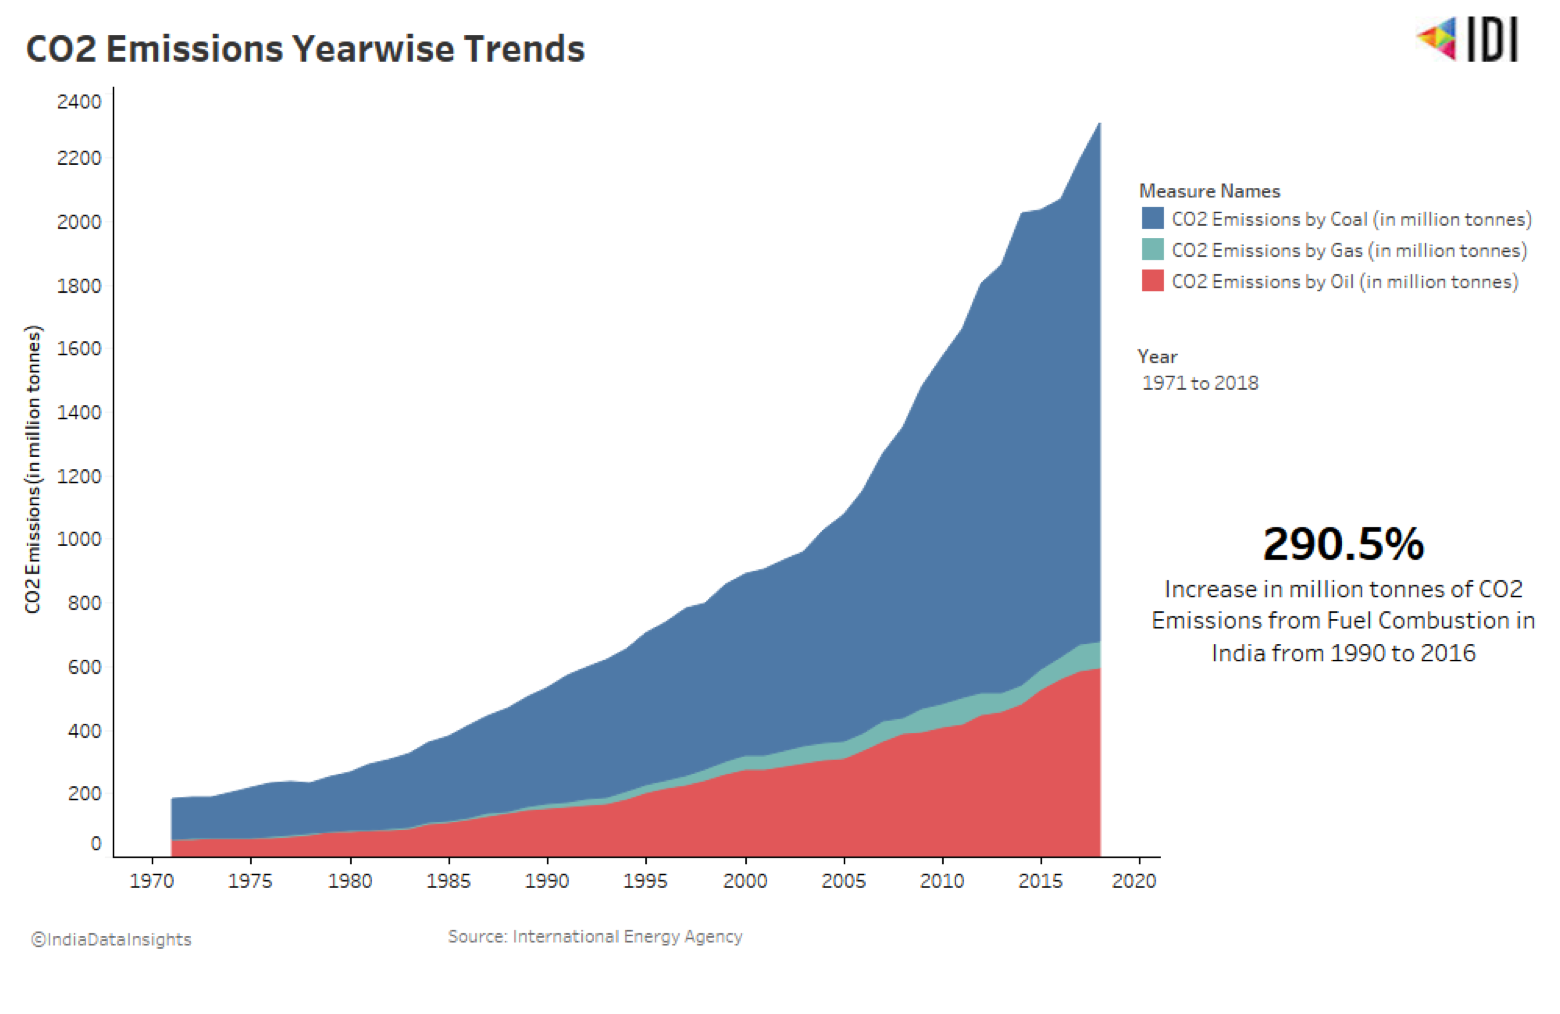 Clearly, there has always been a rise in CO2 emissions since the 1970s, with a 290.5% increase in million tonnes of CO2 Emissions from Fuel Combustion in India from 1990 to 2016.[6]
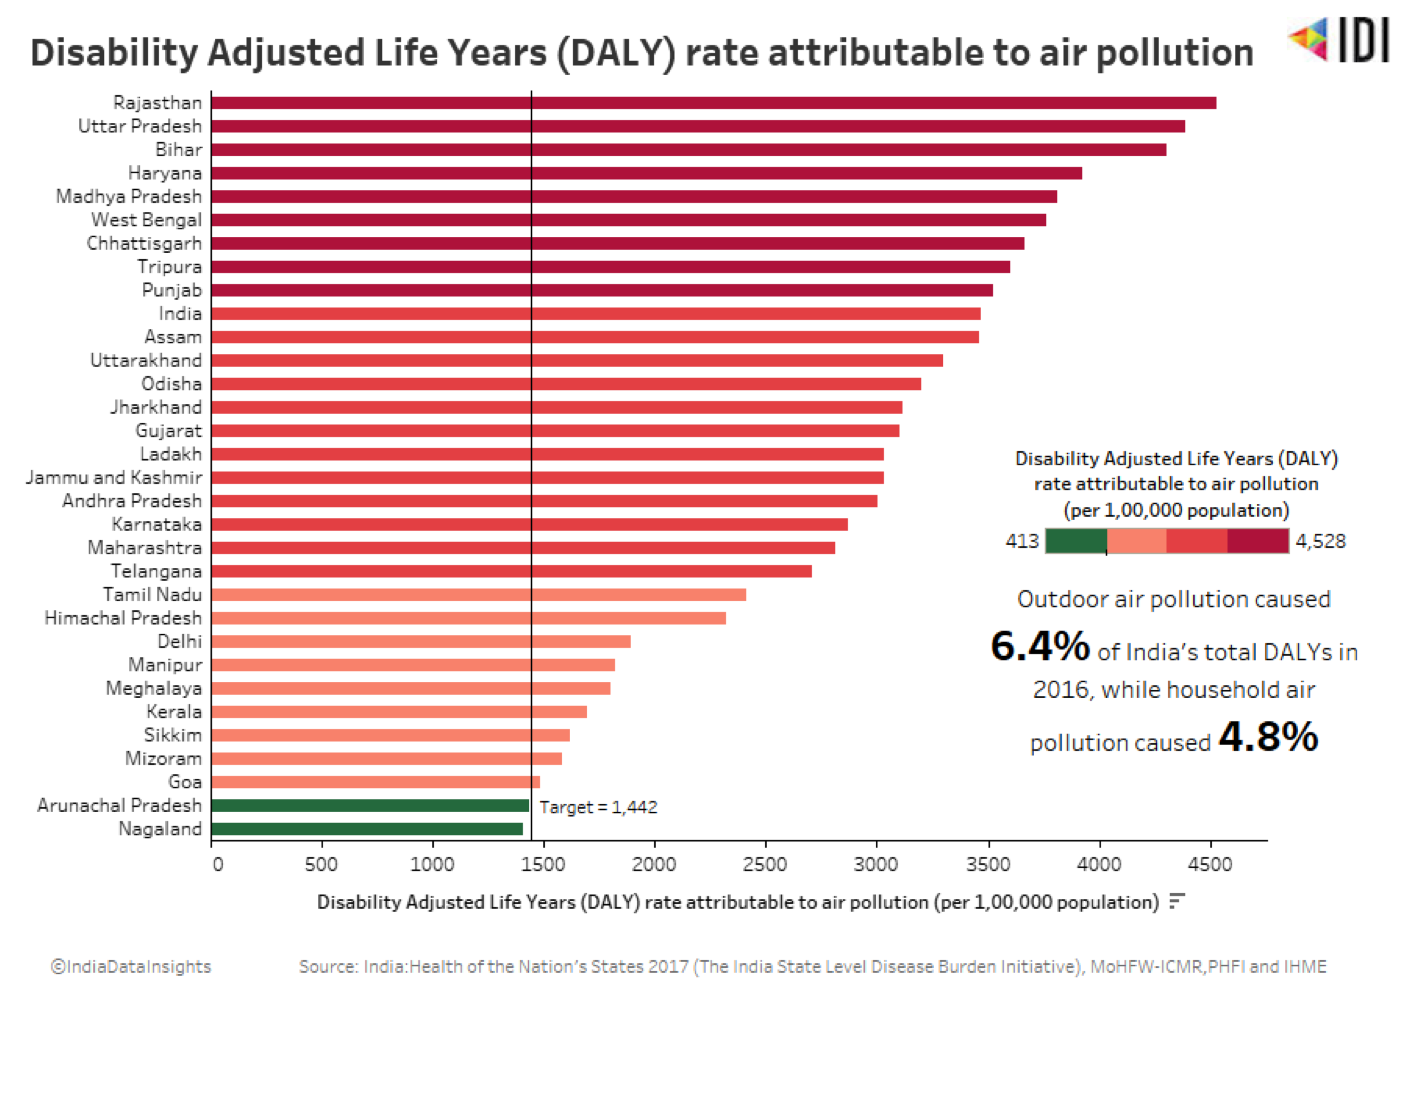 ‘India: Health of the Nation's States 2017’ Report defines Disability Adjusted Life Years (DALY) rate attributable to air pollution (per 100,000 population) as years of healthy life lost to premature death or ill-health due to air pollution. The parameter calculated by The India State Level Disease Burden Initiative shows a dismal picture where in most states are still further away from reaching the set 2030 target which is 1,442 [7]. While Nagaland and Arunachal Pradesh have achieved the set target, Goa, Mizoram, Sikkim and Kerala are close to achieving the target. States like Rajasthan, Uttar Pradesh, Bihar, Haryana, Madhya Pradesh, West Bengal, Chhattisgarh, Tripura and Punjab have DALY rates greater than the India average DALY rate (3,469) and have a long way to go to achieve the target in time. [8]
The most affected State was Rajasthan with a DALY rate of 4,528, while the least affected was Nagaland with a DALY rate of 1,408.
According to ‘India: Health of the Nation's States 2017’ Report, air pollution was the second leading risk factor in India as a whole in 2016. This risk factor includes both outdoor and household air pollution activities ranging from burning fuels for cooking, heating or cooling purposes to greenhouse gases produced by the industrial factories and power plants. Outdoor air pollution caused 6.4% of India’s total DALYs in 2016, while household air pollution caused 4.8%. Together, they make up a considerable part of India's burden of cardiovascular diseases, chronic respiratory diseases, and lower respiratory infections.
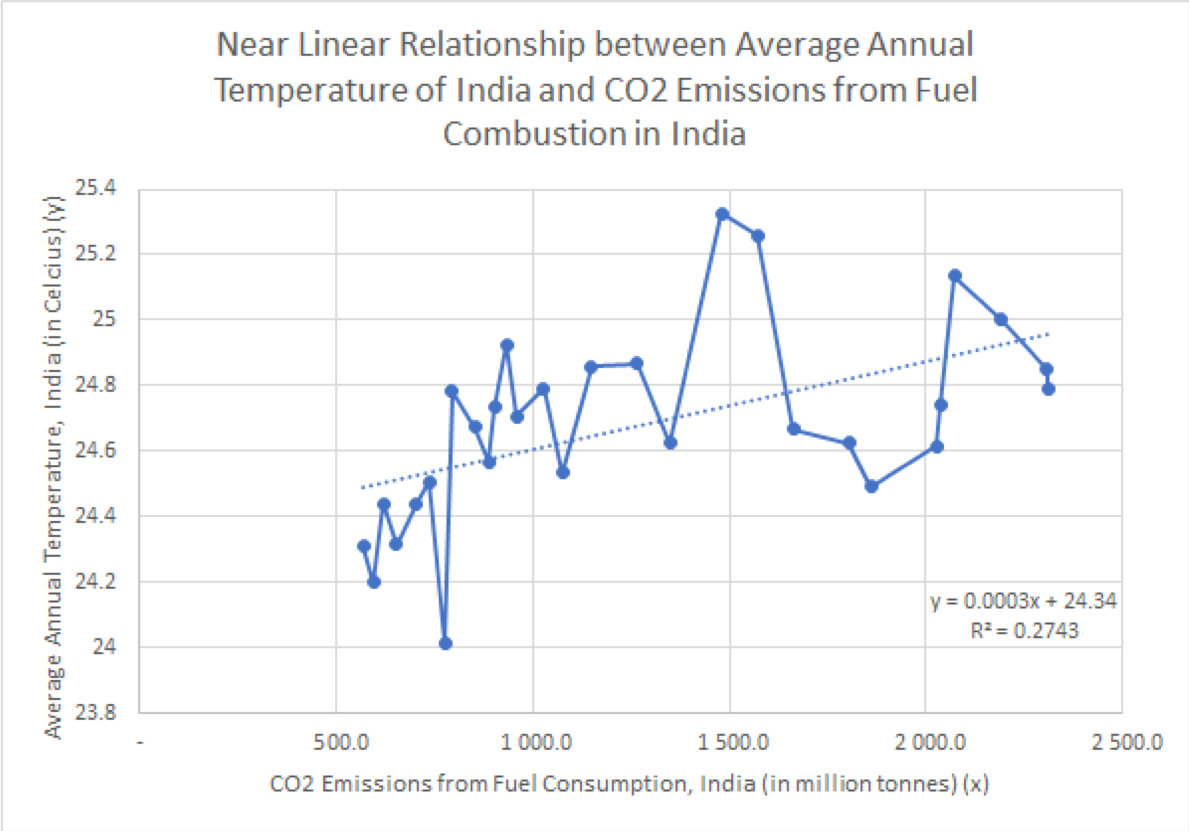
As the heat trapping greenhouse gas levels increase, global warming is on the rise and has its own network effects on climate change. From the scatter plot (Figure 6), it is evident that with every tonne of carbon dioxide emission there is a rise in the average annual temperature to a certain degree in India and with time this heating up poses more and more challenges as we consider this heating up at a global scale.
‘India: Health of the Nation's States 2017’ Report defines Disability Adjusted Life Years (DALY) rate attributable to air pollution (per 100,000 population) as years of healthy life lost to premature death or ill-health due to air pollution. The parameter calculated by The India State Level Disease Burden Initiative shows a dismal picture where in most states are still further away from reaching the set 2030 target which is 1,442 [7]. While Nagaland and Arunachal Pradesh have achieved the set target, Goa, Mizoram, Sikkim and Kerala are close to achieving the target. States like Rajasthan, Uttar Pradesh, Bihar, Haryana, Madhya Pradesh, West Bengal, Chhattisgarh, Tripura and Punjab have DALY rates greater than the India average DALY rate (3,469) and have a long way to go to achieve the target in time. [8]
The most affected State was Rajasthan with a DALY rate of 4,528, while the least affected was Nagaland with a DALY rate of 1,408.
According to ‘India: Health of the Nation's States 2017’ Report, air pollution was the second leading risk factor in India as a whole in 2016. This risk factor includes both outdoor and household air pollution activities ranging from burning fuels for cooking, heating or cooling purposes to greenhouse gases produced by the industrial factories and power plants. Outdoor air pollution caused 6.4% of India’s total DALYs in 2016, while household air pollution caused 4.8%. Together, they make up a considerable part of India's burden of cardiovascular diseases, chronic respiratory diseases, and lower respiratory infections.
As the heat trapping greenhouse gas levels increase, global warming is on the rise and has its own network effects on climate change. From the scatter plot (Figure 6), it is evident that with every tonne of carbon dioxide emission there is a rise in the average annual temperature to a certain degree in India and with time this heating up poses more and more challenges as we consider this heating up at a global scale.
 Data Source:
- Average Annual Temperature, India (in Celcius) - World Bank, 1991-2019
- CO2 Emissions from Fuel Combustion - International Energy Agency, 1991-2019
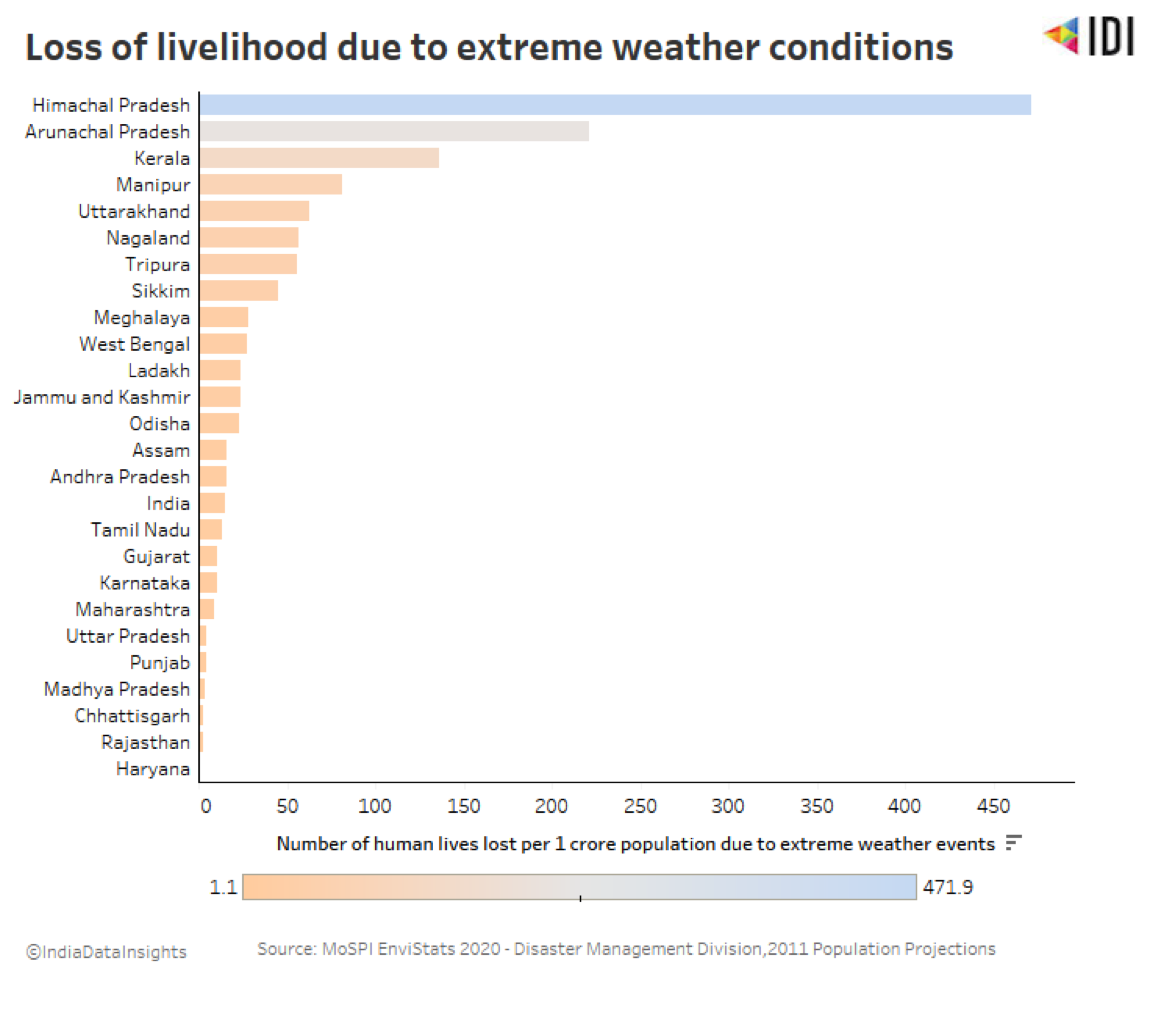 Some of the climate-related concerns are reflected in extreme weather events - the coastal ecosystem exacerbated by sea-level rise and tropical cyclones, landslides in hilly areas. This poses further susceptibility of human health in a developing country like India having more than 1 billion population. According to ‘MoSPI EnviStats 2020 - Disaster Management Division, 2011 Population Projections’ India lost 2,045 lives to extreme weather events including cyclonic storms, heavy rains, floods, landslides etc. in 2018-19, which means 15 Indian lives lost for every 1 crore population.
Need for clean air and energy efficiency
Even though the skies cleared out as the coronavirus lockdown commenced, meeting the rising demands of energy consumption of the growing middle class and the population escaping poverty indicates a further ever-increasing emission of greenhouse gases degrading the air quality further. However, is clean air an opportunity cost to the road of development?
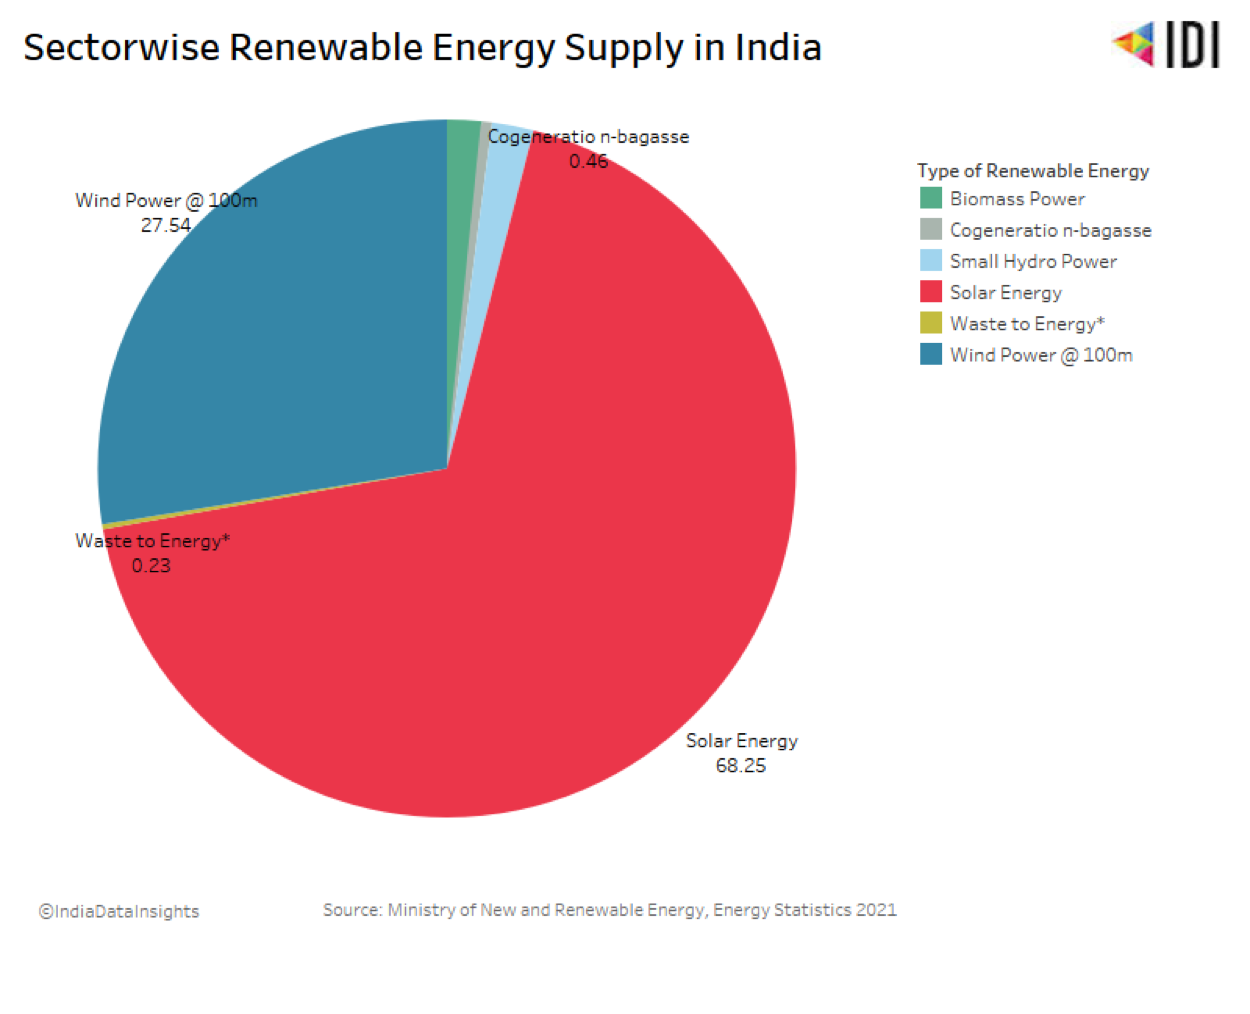
The use of renewable energy has the potential to bridge this opportunity cost. In India, for every Korba, there is a Kutch which replaces some of the energy consumption from coal fired power plants with wind power. Yet another source of renewable energy in use is by tapping the sunlight that shines on India’s wastelands.
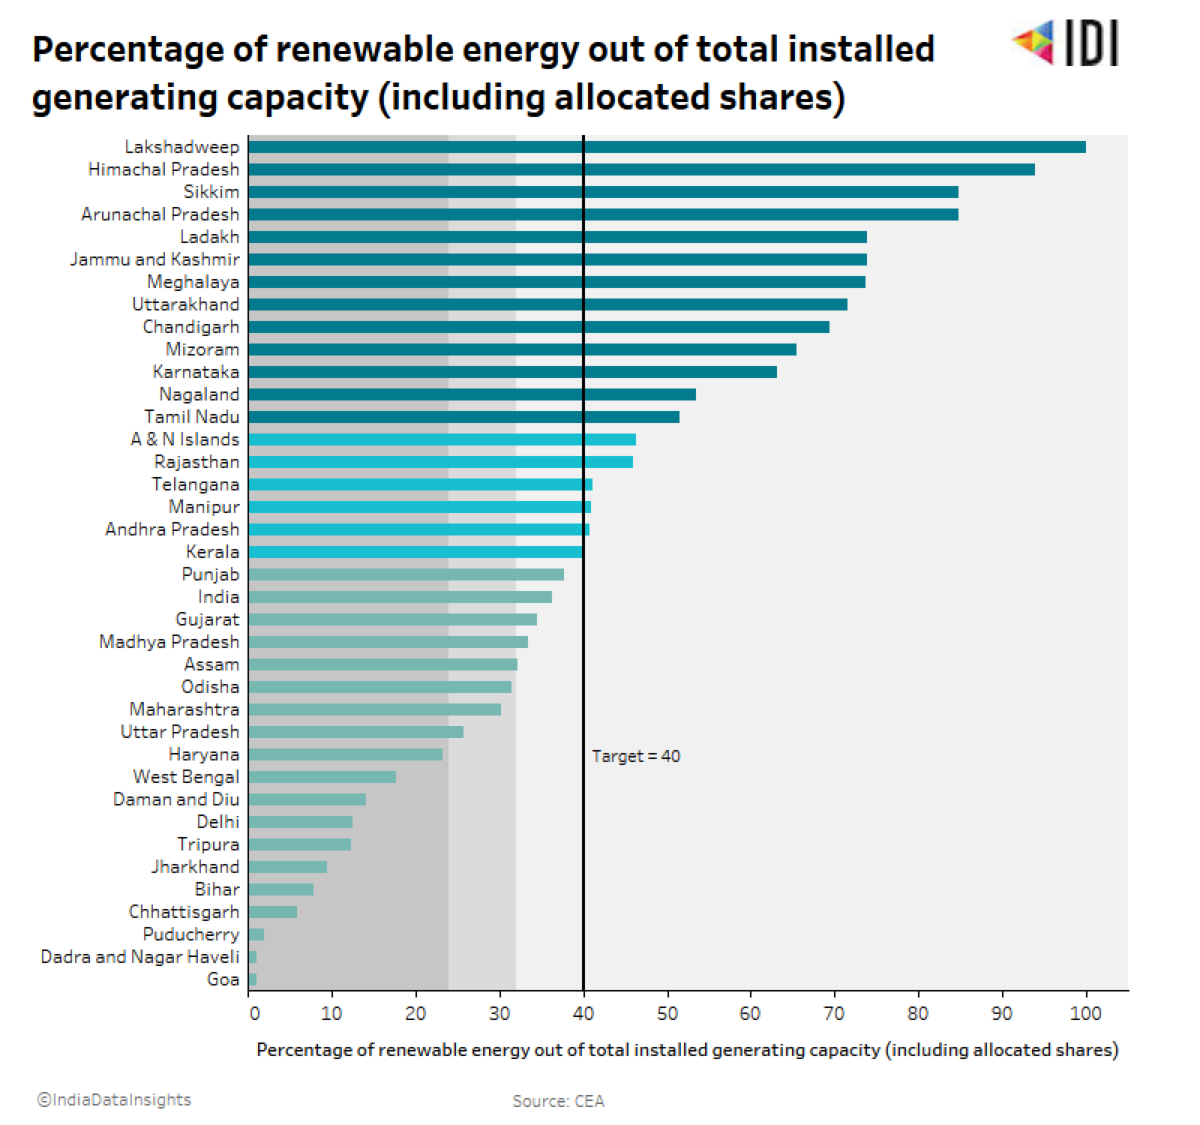
Currently 21% [9] of India’s total energy supply comes from renewable sources out of which wind and solar energy are harnessed the most. Rajasthan has the highest share of about 15% (162223 MW) in production of energy from renewable sources. This is followed by Gujarat with 11% share (122086 MW). Both Maharashtra and Jammu & Kashmir come next with a 10% share (113925MW and 112800 MW respectively), mainly on account of solar power. However, amongst these, the share of Wind Power is the highest in Gujarat which houses a number of wind turbines in Kutch. [10]
Some of the climate-related concerns are reflected in extreme weather events - the coastal ecosystem exacerbated by sea-level rise and tropical cyclones, landslides in hilly areas. This poses further susceptibility of human health in a developing country like India having more than 1 billion population. According to ‘MoSPI EnviStats 2020 - Disaster Management Division, 2011 Population Projections’ India lost 2,045 lives to extreme weather events including cyclonic storms, heavy rains, floods, landslides etc. in 2018-19, which means 15 Indian lives lost for every 1 crore population.
Need for clean air and energy efficiency
Even though the skies cleared out as the coronavirus lockdown commenced, meeting the rising demands of energy consumption of the growing middle class and the population escaping poverty indicates a further ever-increasing emission of greenhouse gases degrading the air quality further. However, is clean air an opportunity cost to the road of development?
The use of renewable energy has the potential to bridge this opportunity cost. In India, for every Korba, there is a Kutch which replaces some of the energy consumption from coal fired power plants with wind power. Yet another source of renewable energy in use is by tapping the sunlight that shines on India’s wastelands.
Currently 21% [9] of India’s total energy supply comes from renewable sources out of which wind and solar energy are harnessed the most. Rajasthan has the highest share of about 15% (162223 MW) in production of energy from renewable sources. This is followed by Gujarat with 11% share (122086 MW). Both Maharashtra and Jammu & Kashmir come next with a 10% share (113925MW and 112800 MW respectively), mainly on account of solar power. However, amongst these, the share of Wind Power is the highest in Gujarat which houses a number of wind turbines in Kutch. [10]
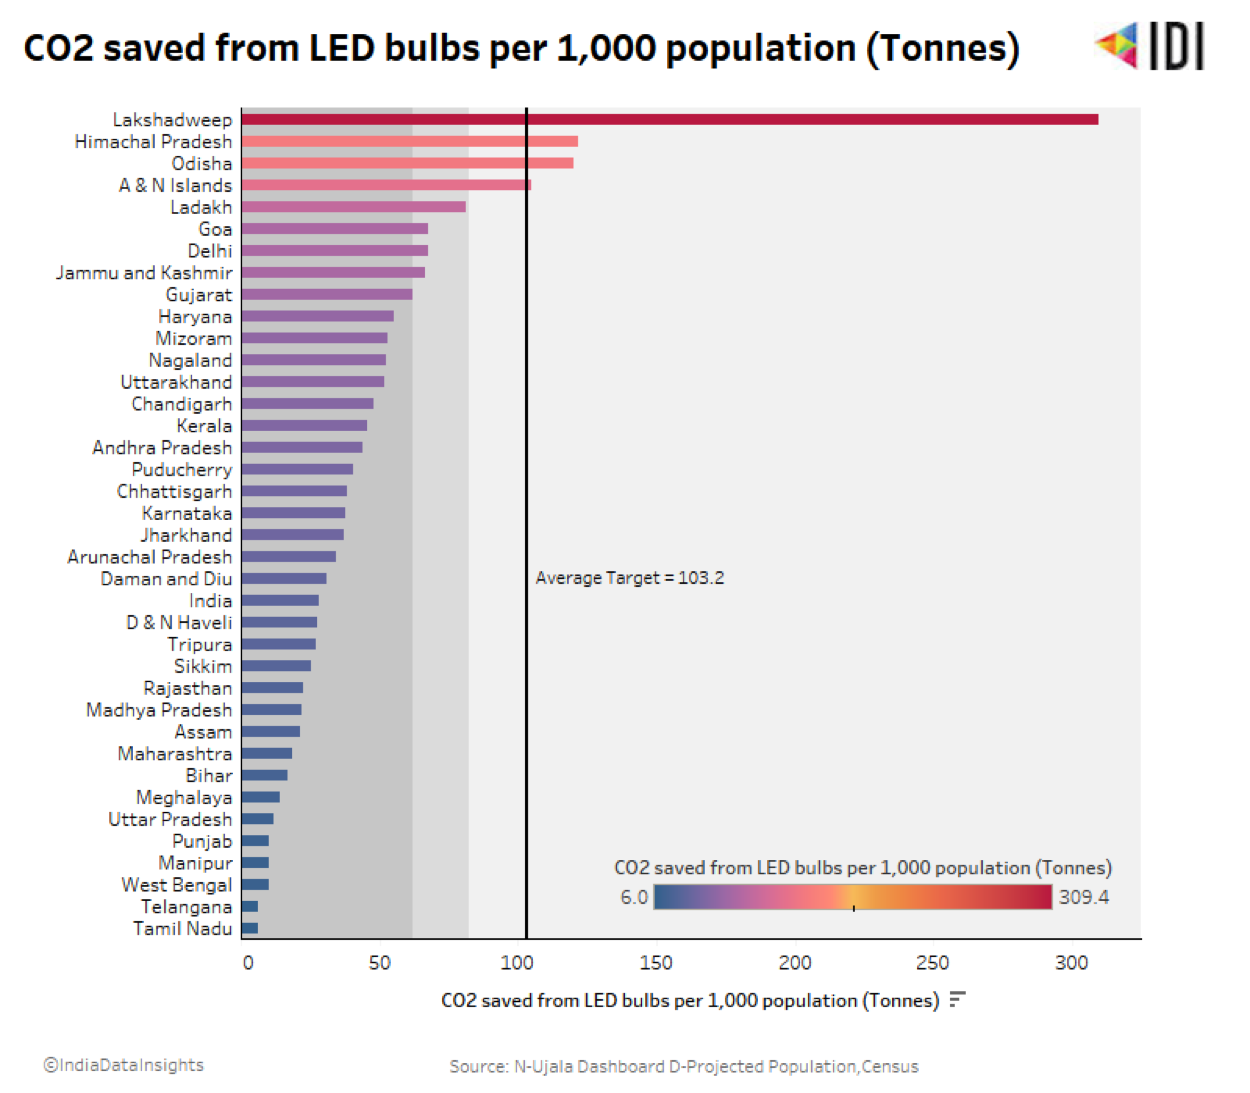 India has additionally saved on producing carbon dioxide emissions through the use of LED bulbs. Lakshadweep, Himachal Pradesh, Odisha and Andaman & Nicobar Islands have achieved the set target at 103.2. However, all other states are still away from the set target by the NITI Aayog report - SDG India Index and Dashboard 2020-21 Report.
As India’s economy continues to expand, there is a need to increasingly focus on clean energy so that carbon pollution doesn’t trap different sectors of the economy and human health and livelihood with further grave concerns.
Sources:
India has additionally saved on producing carbon dioxide emissions through the use of LED bulbs. Lakshadweep, Himachal Pradesh, Odisha and Andaman & Nicobar Islands have achieved the set target at 103.2. However, all other states are still away from the set target by the NITI Aayog report - SDG India Index and Dashboard 2020-21 Report.
As India’s economy continues to expand, there is a need to increasingly focus on clean energy so that carbon pollution doesn’t trap different sectors of the economy and human health and livelihood with further grave concerns.
Sources:
- [1] www.environmentalgraphiti.org
- [2] [4] Energy Statistics India, 2021
- [3] [5] [6] [9] International Energy Agency
- [4] Energy Statistics India, 2021
- [7] [8] SDG INDIA Index & Dashboard 2020-21 Partnerships in the Decade of Action, NITI Aayog, March 2021
- [10] Ministry of New and Renewable Energy, Energy Statistics 2021