Expenses to Behavior – Analysis of Per Capita Expenditure in India
Expenses to Behavior – Analysis of Per Capita Expenditure in India
Published on :- May 7th, 2024
The National Sample Survey Office (NSSO) has been conducting household surveys on consumer expenditure and employment-unemployment on a large scale. While this was an annual survey until 1971-72, it was changed to every five years from the 27th round (1972-73). The last Household Consumption Expenditure Survey (HCES) was conducted in 2011-12. After a decade, NSSO published the results of its latest HCES - 2022-23 as a factsheet. This survey covers the data gathered from approximately 2.62 lakh households nationwide. There have been some changes to the methodology in the latest survey, which limits the comparison of these with values from previous surveys (section: Issues related to comparability). For the years 1999-00 & 2004-05, estimates are based on Mixed Reference Period (MRP) and for the years 2009-10, 2011-12 and 2022-23, these are based on Modified MRP (MMRP).Note: MRP: The estimate of MPCE is based on household consumer expenditure on – (i) clothing and bedding, footwear, education, institutional medical care, and durable goods recorded for a reference period of “last 365 days”, and (ii) expenditure on all other items recorded for a reference period of “last 30 days”.
MMRP: The estimate of MPCE is based on household consumer expenditure on edible oil, egg, fish and meat, vegetables, fruits, spices, beverages, refreshments, processed food, pan, tobacco and intoxicants recorded for a reference period of “last 7 days”, and for all other items, recorded for the same reference period as in case of Mixed Reference Period.
We understand the survey results cannot be compared due to the change in the methodology and how the estimates are derived. Hence, through this data dialogue, our objective is to provide easy-to-understand visual data insights by analysing the trends in Monthly Per Capita Expenditure (MPCE—with imputation at the current price) using the data published in the most recent HCES factsheet 2022-23. The analysis covers expenditure patterns spanning over two decades, encompassing both rural and urban areas as well as across various expenditure categories.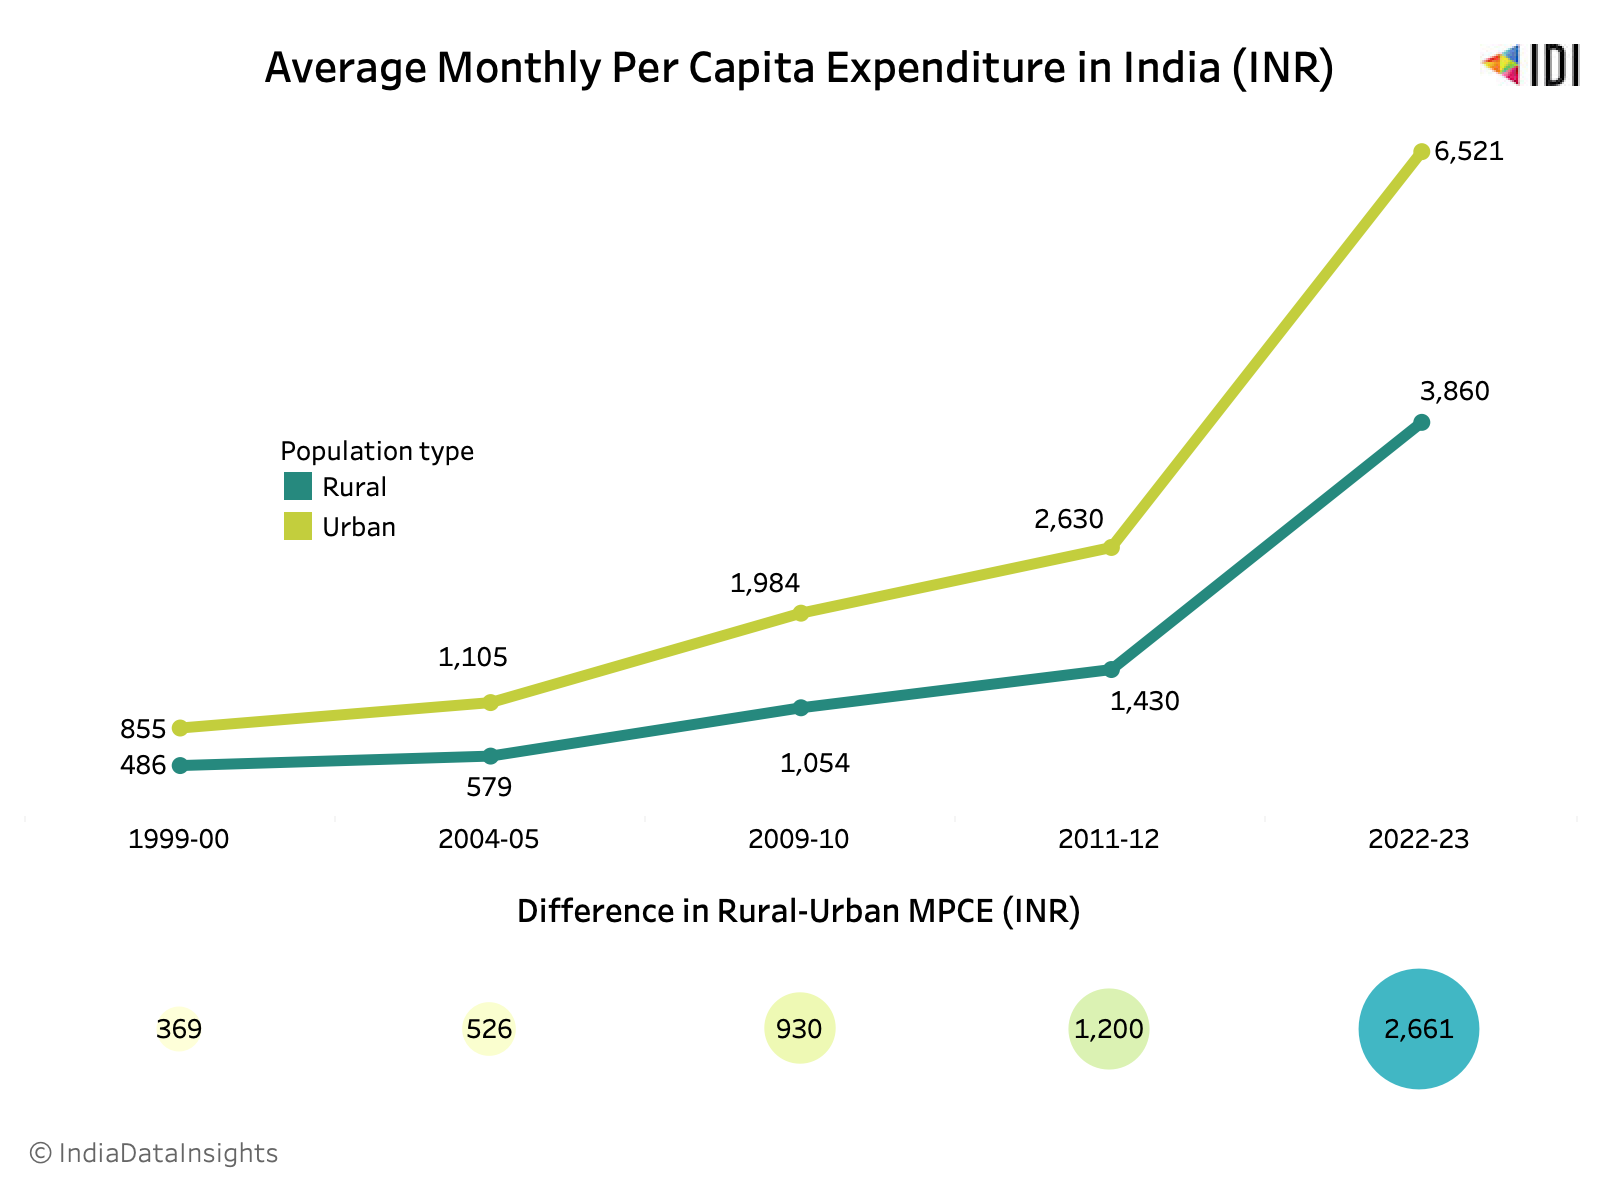 The urban MPCE in 1999-2000 was INR 369 more than the rural MPCE. After over two decades, in 2022-23, the MPCE difference between urban and rural is INR 2661. The percentage difference between rural-urban MPCE was highest in 2004-05 - 90.8%. In terms of absolute value, the difference was INR 526. In 2022-23, though the difference in MPCE absolute value was as high as INR 2661, the percentage difference between urban and rural MPCE was ~69% - indicating that rural expenditure is increasing at a higher rate than its urban counterpart.
During the last decade (2011-12 to 2022-23), the difference in rural-urban MPCE has more than doubled. During the same period, while the urban MPCE has increased by INR 3891 (~148%), the rural MPCE has increased by 2430 (~170%).
The urban MPCE in 1999-2000 was INR 369 more than the rural MPCE. After over two decades, in 2022-23, the MPCE difference between urban and rural is INR 2661. The percentage difference between rural-urban MPCE was highest in 2004-05 - 90.8%. In terms of absolute value, the difference was INR 526. In 2022-23, though the difference in MPCE absolute value was as high as INR 2661, the percentage difference between urban and rural MPCE was ~69% - indicating that rural expenditure is increasing at a higher rate than its urban counterpart.
During the last decade (2011-12 to 2022-23), the difference in rural-urban MPCE has more than doubled. During the same period, while the urban MPCE has increased by INR 3891 (~148%), the rural MPCE has increased by 2430 (~170%).
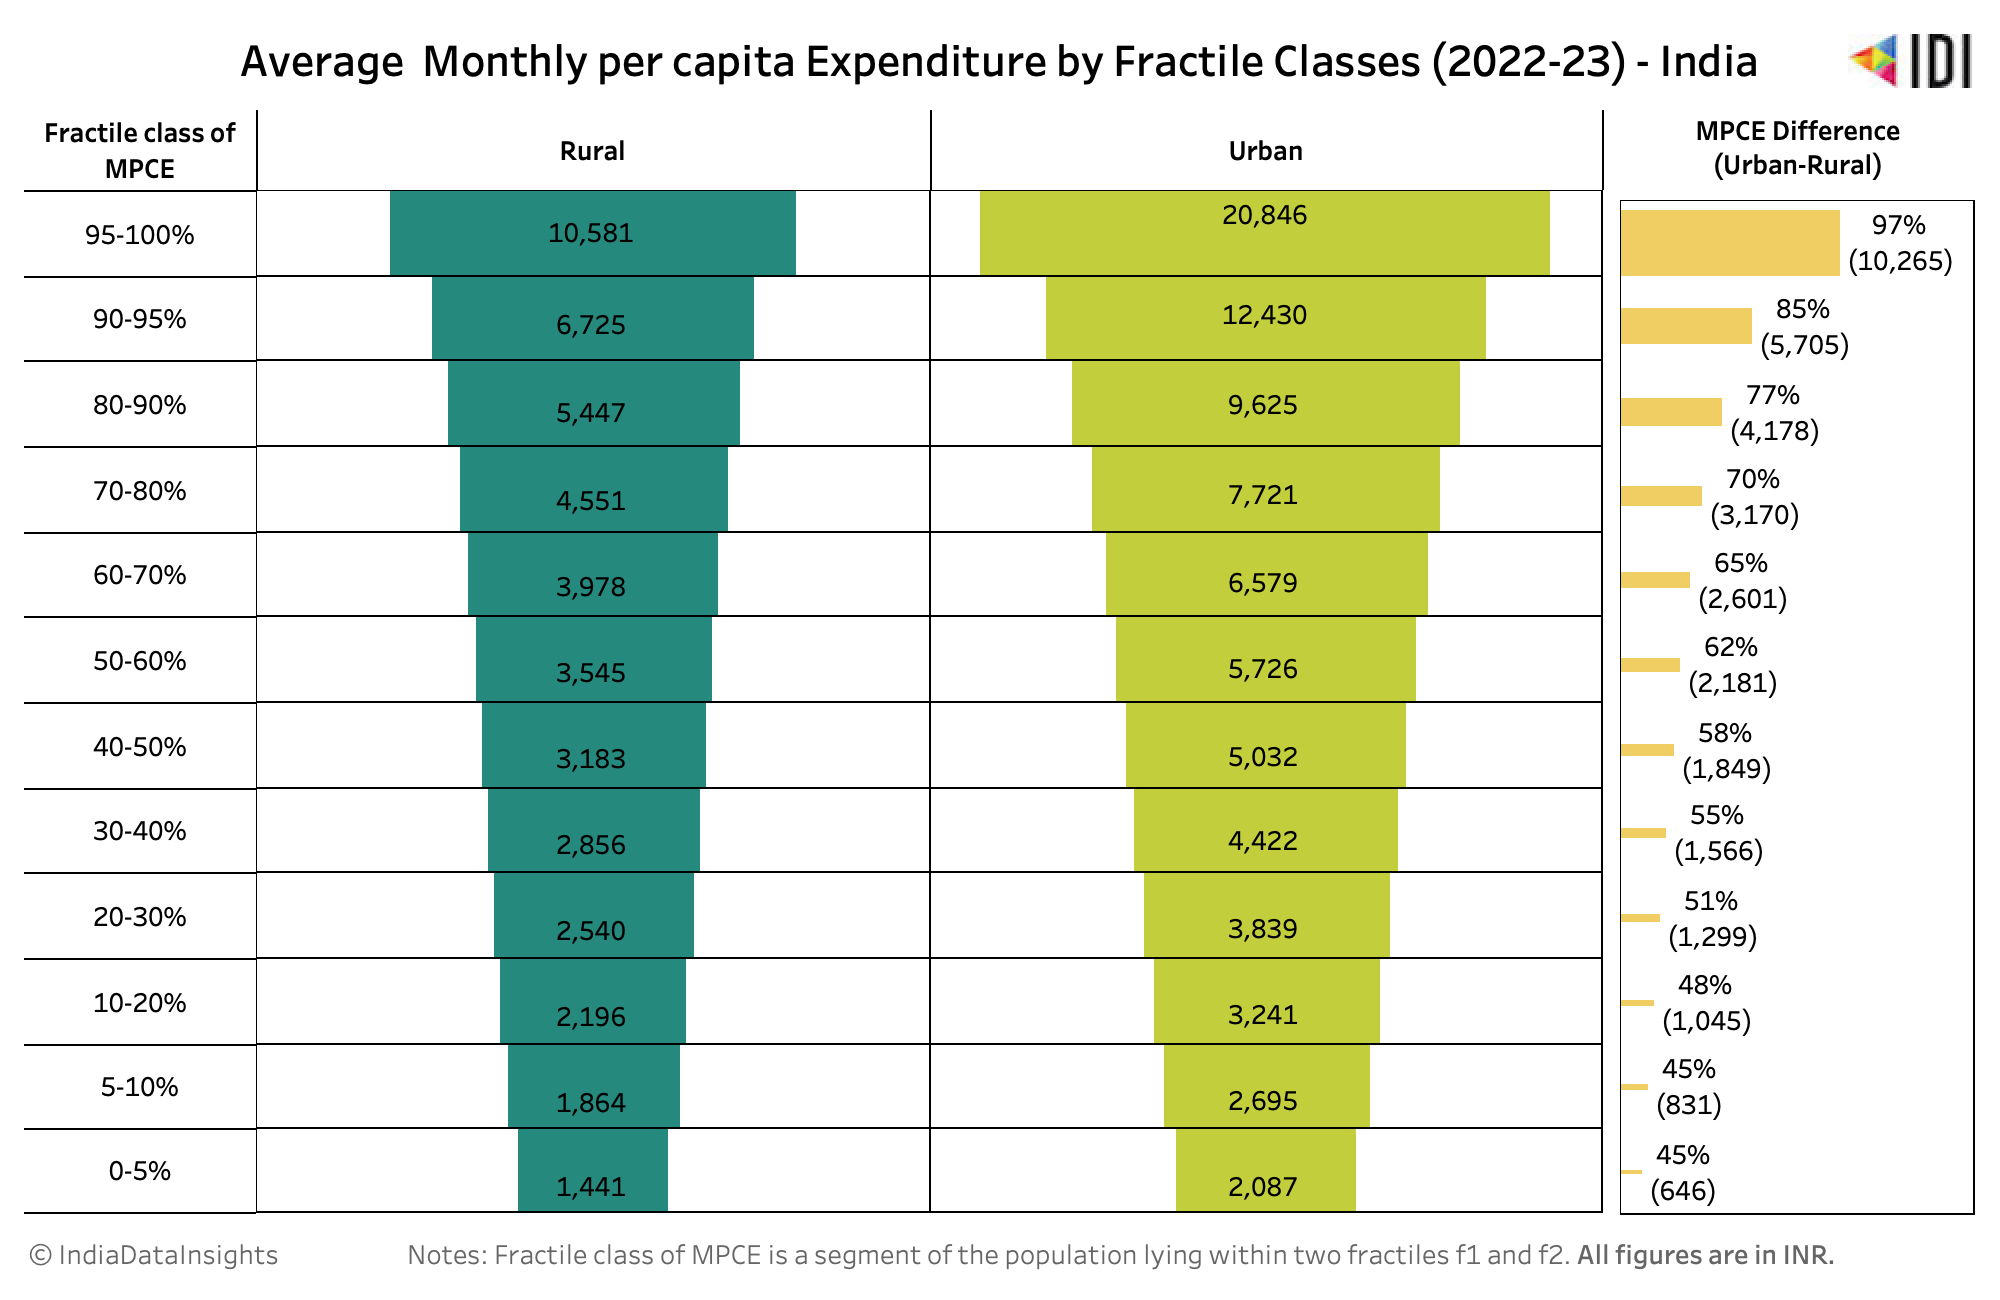 As per the 2022-23 survey results, the difference between urban and rural MPCE is 50% or less in the population lying in the lower fractiles of MPCE.
This difference widens as we move towards a higher fractile class of MPCE. In the 95-100% class, the per capita monthly expenditure of urban households is nearly double that of rural households.
As per the 2022-23 survey results, the difference between urban and rural MPCE is 50% or less in the population lying in the lower fractiles of MPCE.
This difference widens as we move towards a higher fractile class of MPCE. In the 95-100% class, the per capita monthly expenditure of urban households is nearly double that of rural households.
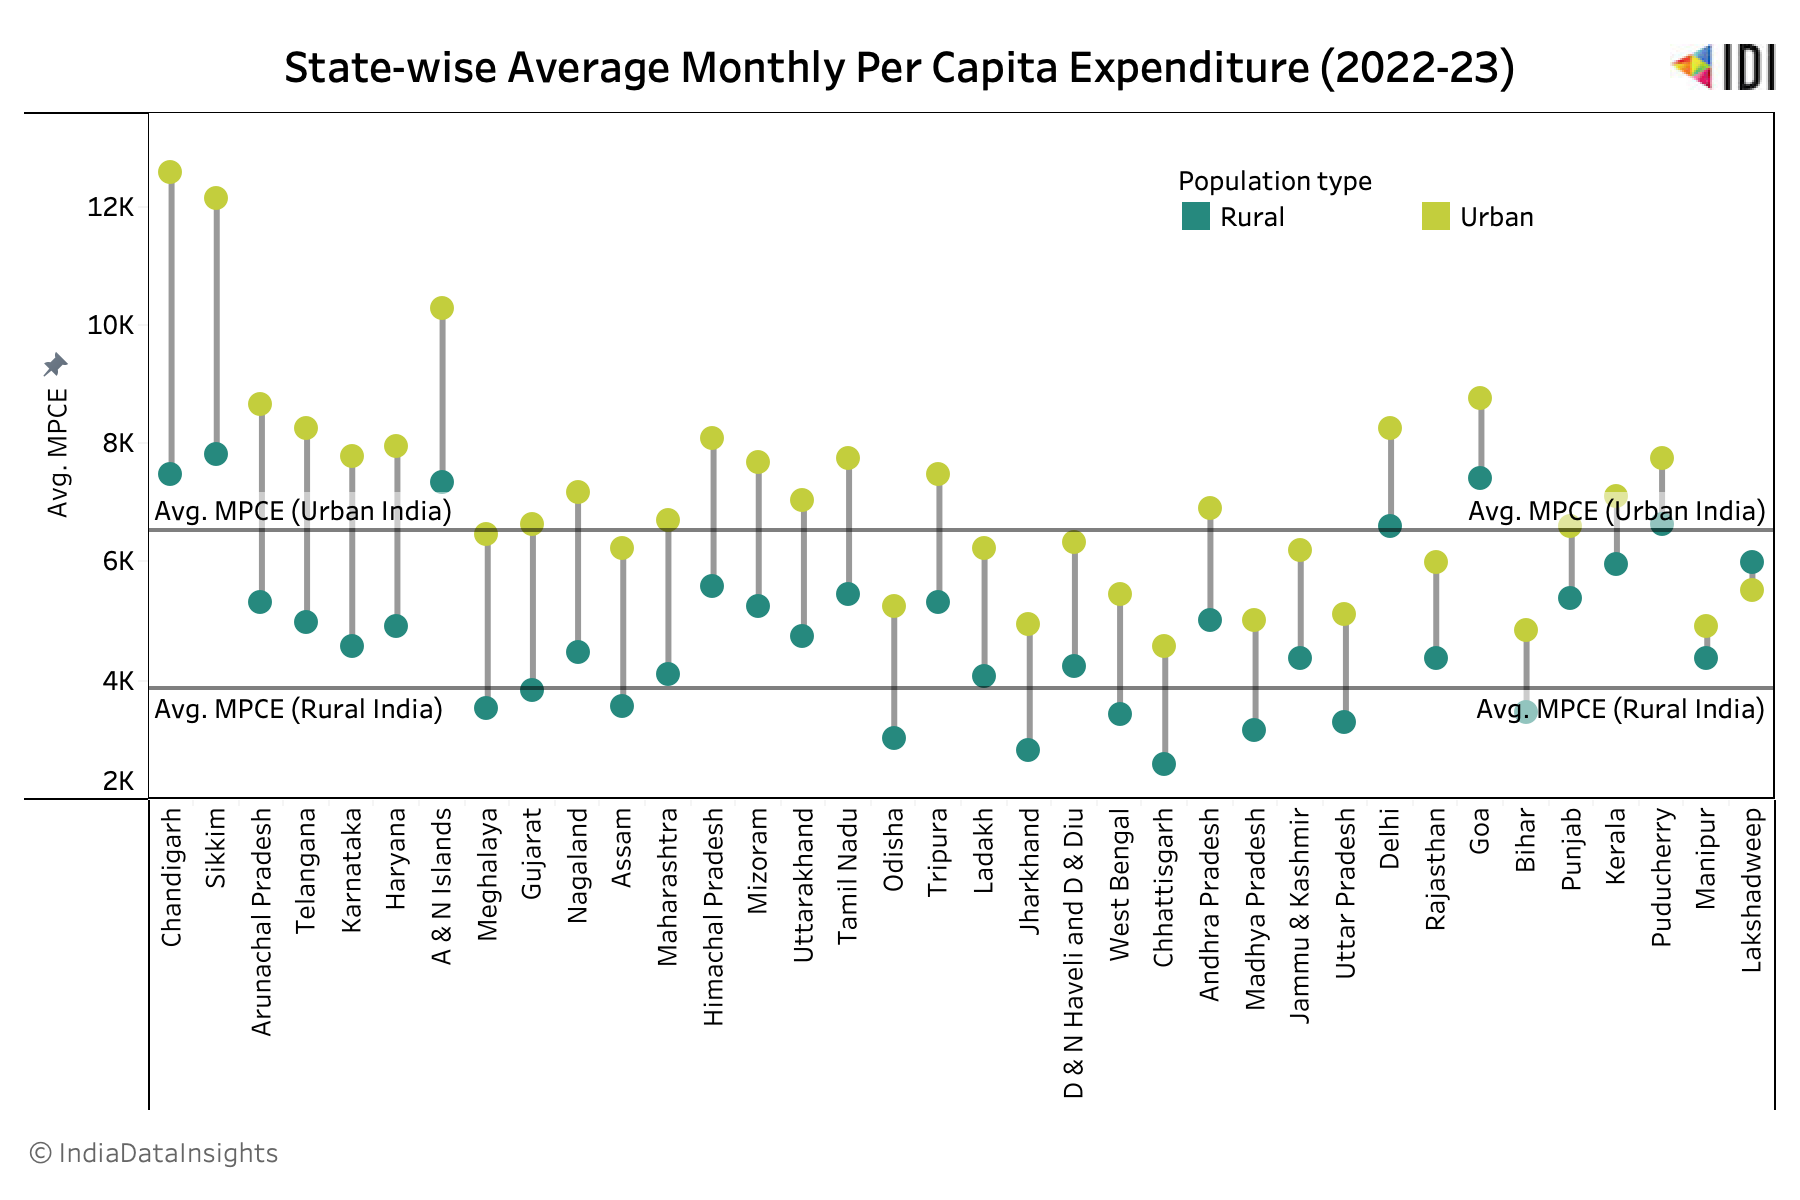 In 2022-23, the average MPCEs of States/UTs such as Sikkim, Chandigarh, Andaman & Nicobar Islands, Goa, Delhi and Kerala (both rural and urban households) was higher than the India average MPCE for urban households. States such as Meghalaya, Assam, Chhattisgarh, Odisha, West Bengal Madhya Pradesh, Uttar Pradesh, Jharkhand and Bihar have both their rural and urban MPCEs lower than their respective India average values.
The percentage difference in MPCE between urban and rural households has been the highest in Meghalaya (82.7%—INR 2920) and the lowest in Lakshadweep (8%—INR 468). In terms of the absolute value of MPCE, the difference is highest in Chandigarh (INR 5111), followed by Sikkim (INR 4338).
In 2022-23, the average MPCEs of States/UTs such as Sikkim, Chandigarh, Andaman & Nicobar Islands, Goa, Delhi and Kerala (both rural and urban households) was higher than the India average MPCE for urban households. States such as Meghalaya, Assam, Chhattisgarh, Odisha, West Bengal Madhya Pradesh, Uttar Pradesh, Jharkhand and Bihar have both their rural and urban MPCEs lower than their respective India average values.
The percentage difference in MPCE between urban and rural households has been the highest in Meghalaya (82.7%—INR 2920) and the lowest in Lakshadweep (8%—INR 468). In terms of the absolute value of MPCE, the difference is highest in Chandigarh (INR 5111), followed by Sikkim (INR 4338).
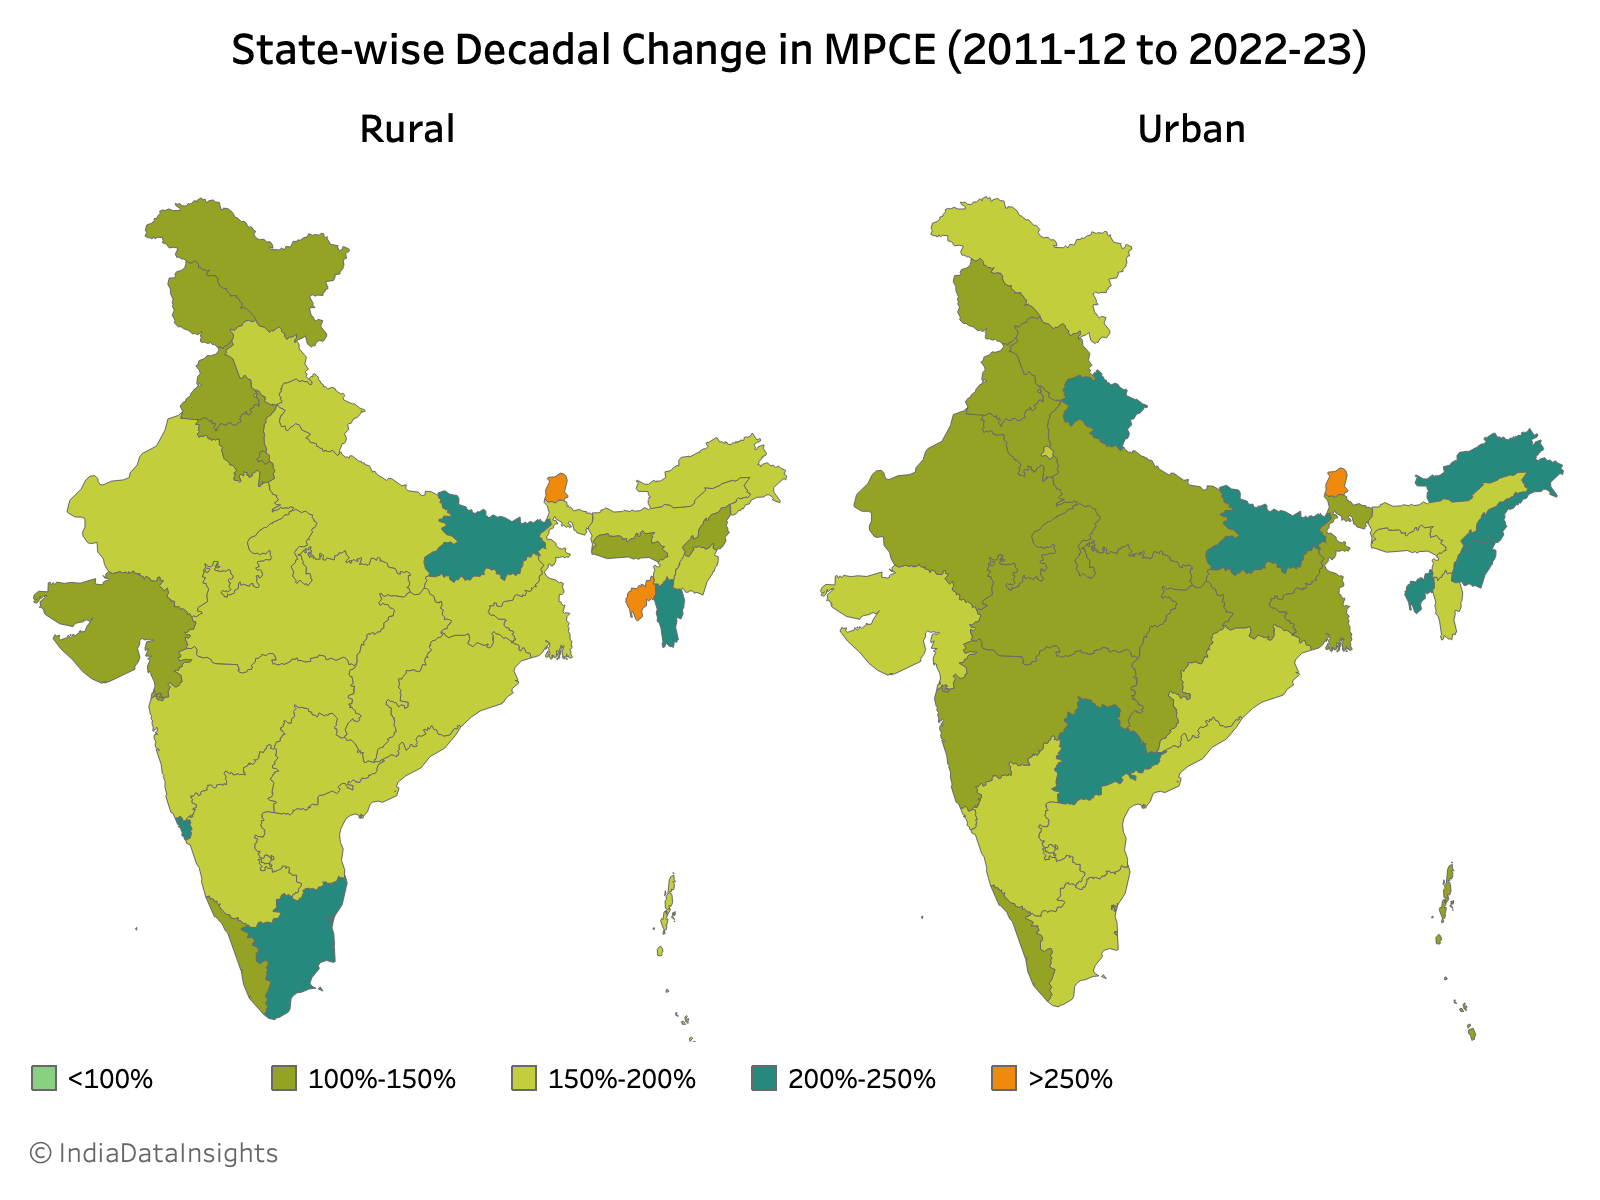 In a decade (2011-12 to 2022-23), the average MPCE across all states/UTs (except urban households in Lakshadweep) has more than doubled. Among urban households, while expenditures in the central and northern regions have increased by 100-150%, expenditures in the southern and north eastern states have increased by more than 150%. The average MPCE in rural households in most states of India has also increased by more than 150%.
Sikkim has witnessed the highest increase in average monthly per capita expenditure across both rural and urban areas - an increase of more than 250%.
In a decade (2011-12 to 2022-23), the average MPCE across all states/UTs (except urban households in Lakshadweep) has more than doubled. Among urban households, while expenditures in the central and northern regions have increased by 100-150%, expenditures in the southern and north eastern states have increased by more than 150%. The average MPCE in rural households in most states of India has also increased by more than 150%.
Sikkim has witnessed the highest increase in average monthly per capita expenditure across both rural and urban areas - an increase of more than 250%.
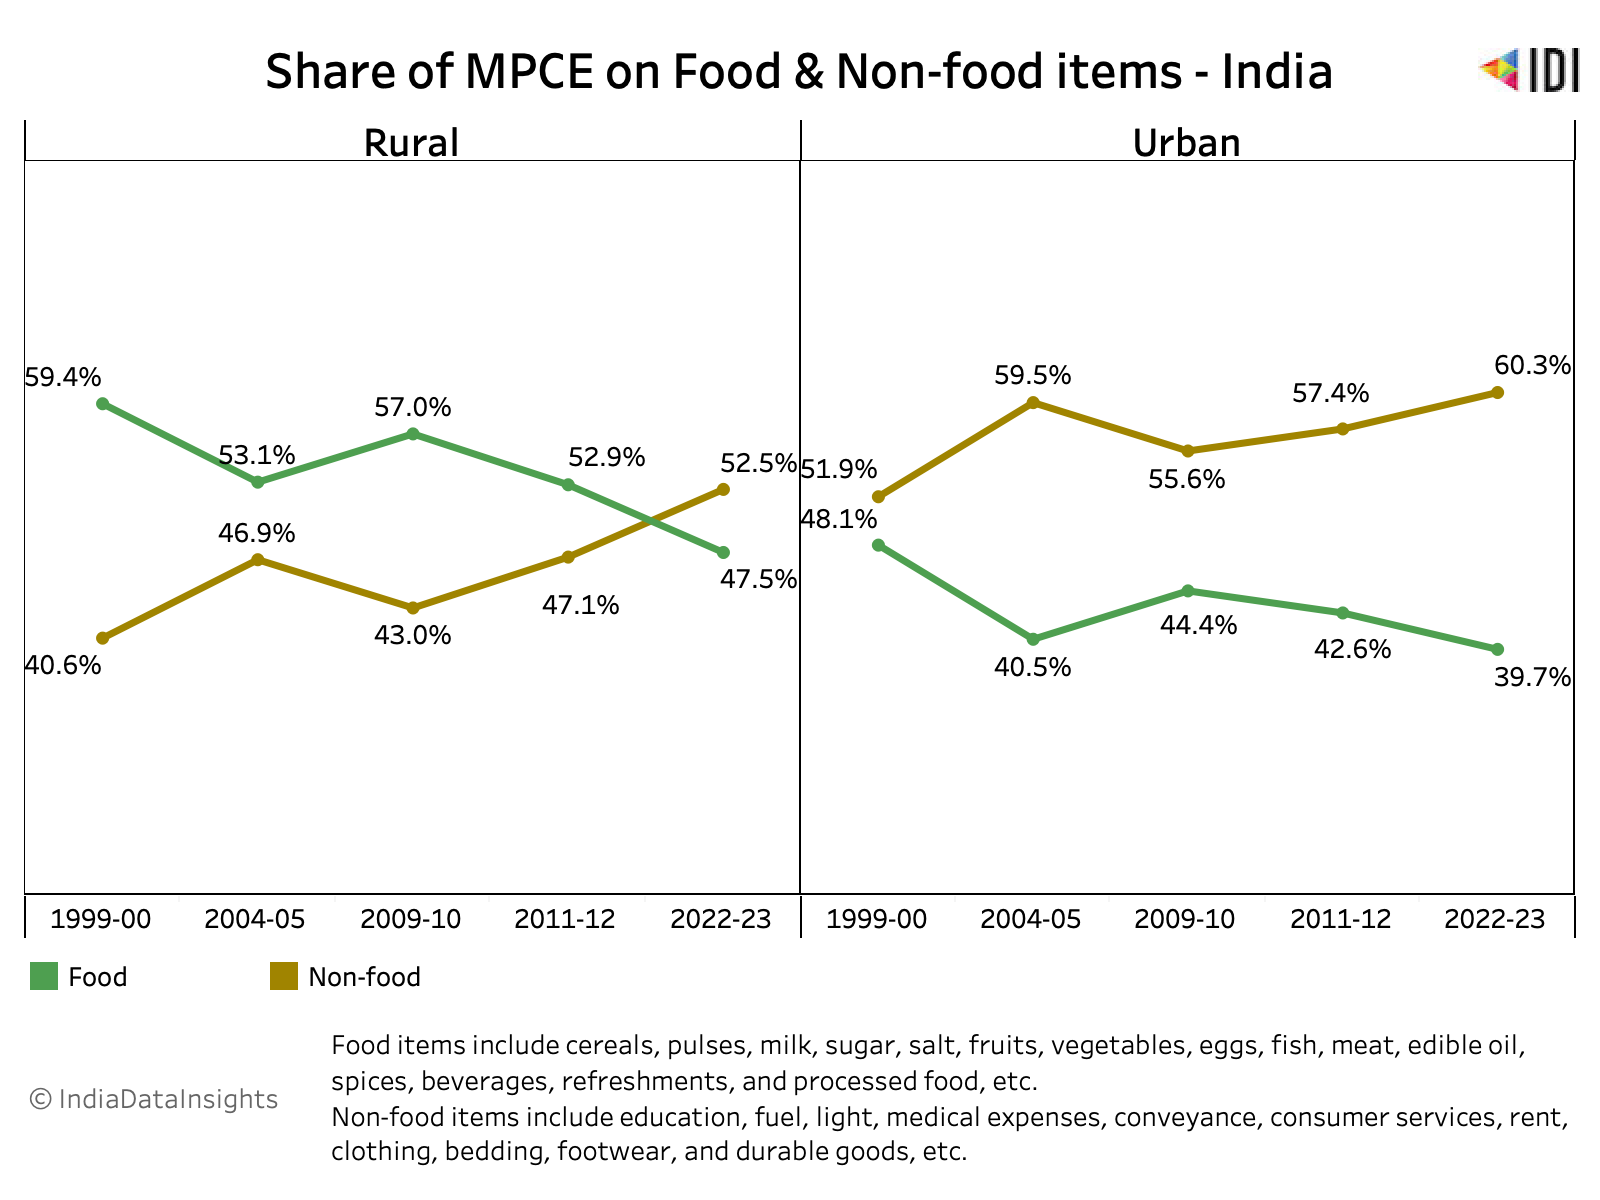 Over the years, the expenditure trends on food and non-food items have changed. In 1999-2000, the average MPCE ratio between food and non-food items in rural households was 3:2 and in urban households, this ratio was almost equal. After two decades in 2022-23, the average MPCE ratio between food and non-food items in rural households is now almost equal (1:1) - in fact expenditures on food items constitute a slightly smaller share of monthly expenditures than non-food items. The expenditure ratio between food and non-food items in urban households is now 2:3.
Rural households seem to spend a larger share of their monthly income on food items than their urban counterparts.
Over the years, the expenditure trends on food and non-food items have changed. In 1999-2000, the average MPCE ratio between food and non-food items in rural households was 3:2 and in urban households, this ratio was almost equal. After two decades in 2022-23, the average MPCE ratio between food and non-food items in rural households is now almost equal (1:1) - in fact expenditures on food items constitute a slightly smaller share of monthly expenditures than non-food items. The expenditure ratio between food and non-food items in urban households is now 2:3.
Rural households seem to spend a larger share of their monthly income on food items than their urban counterparts.
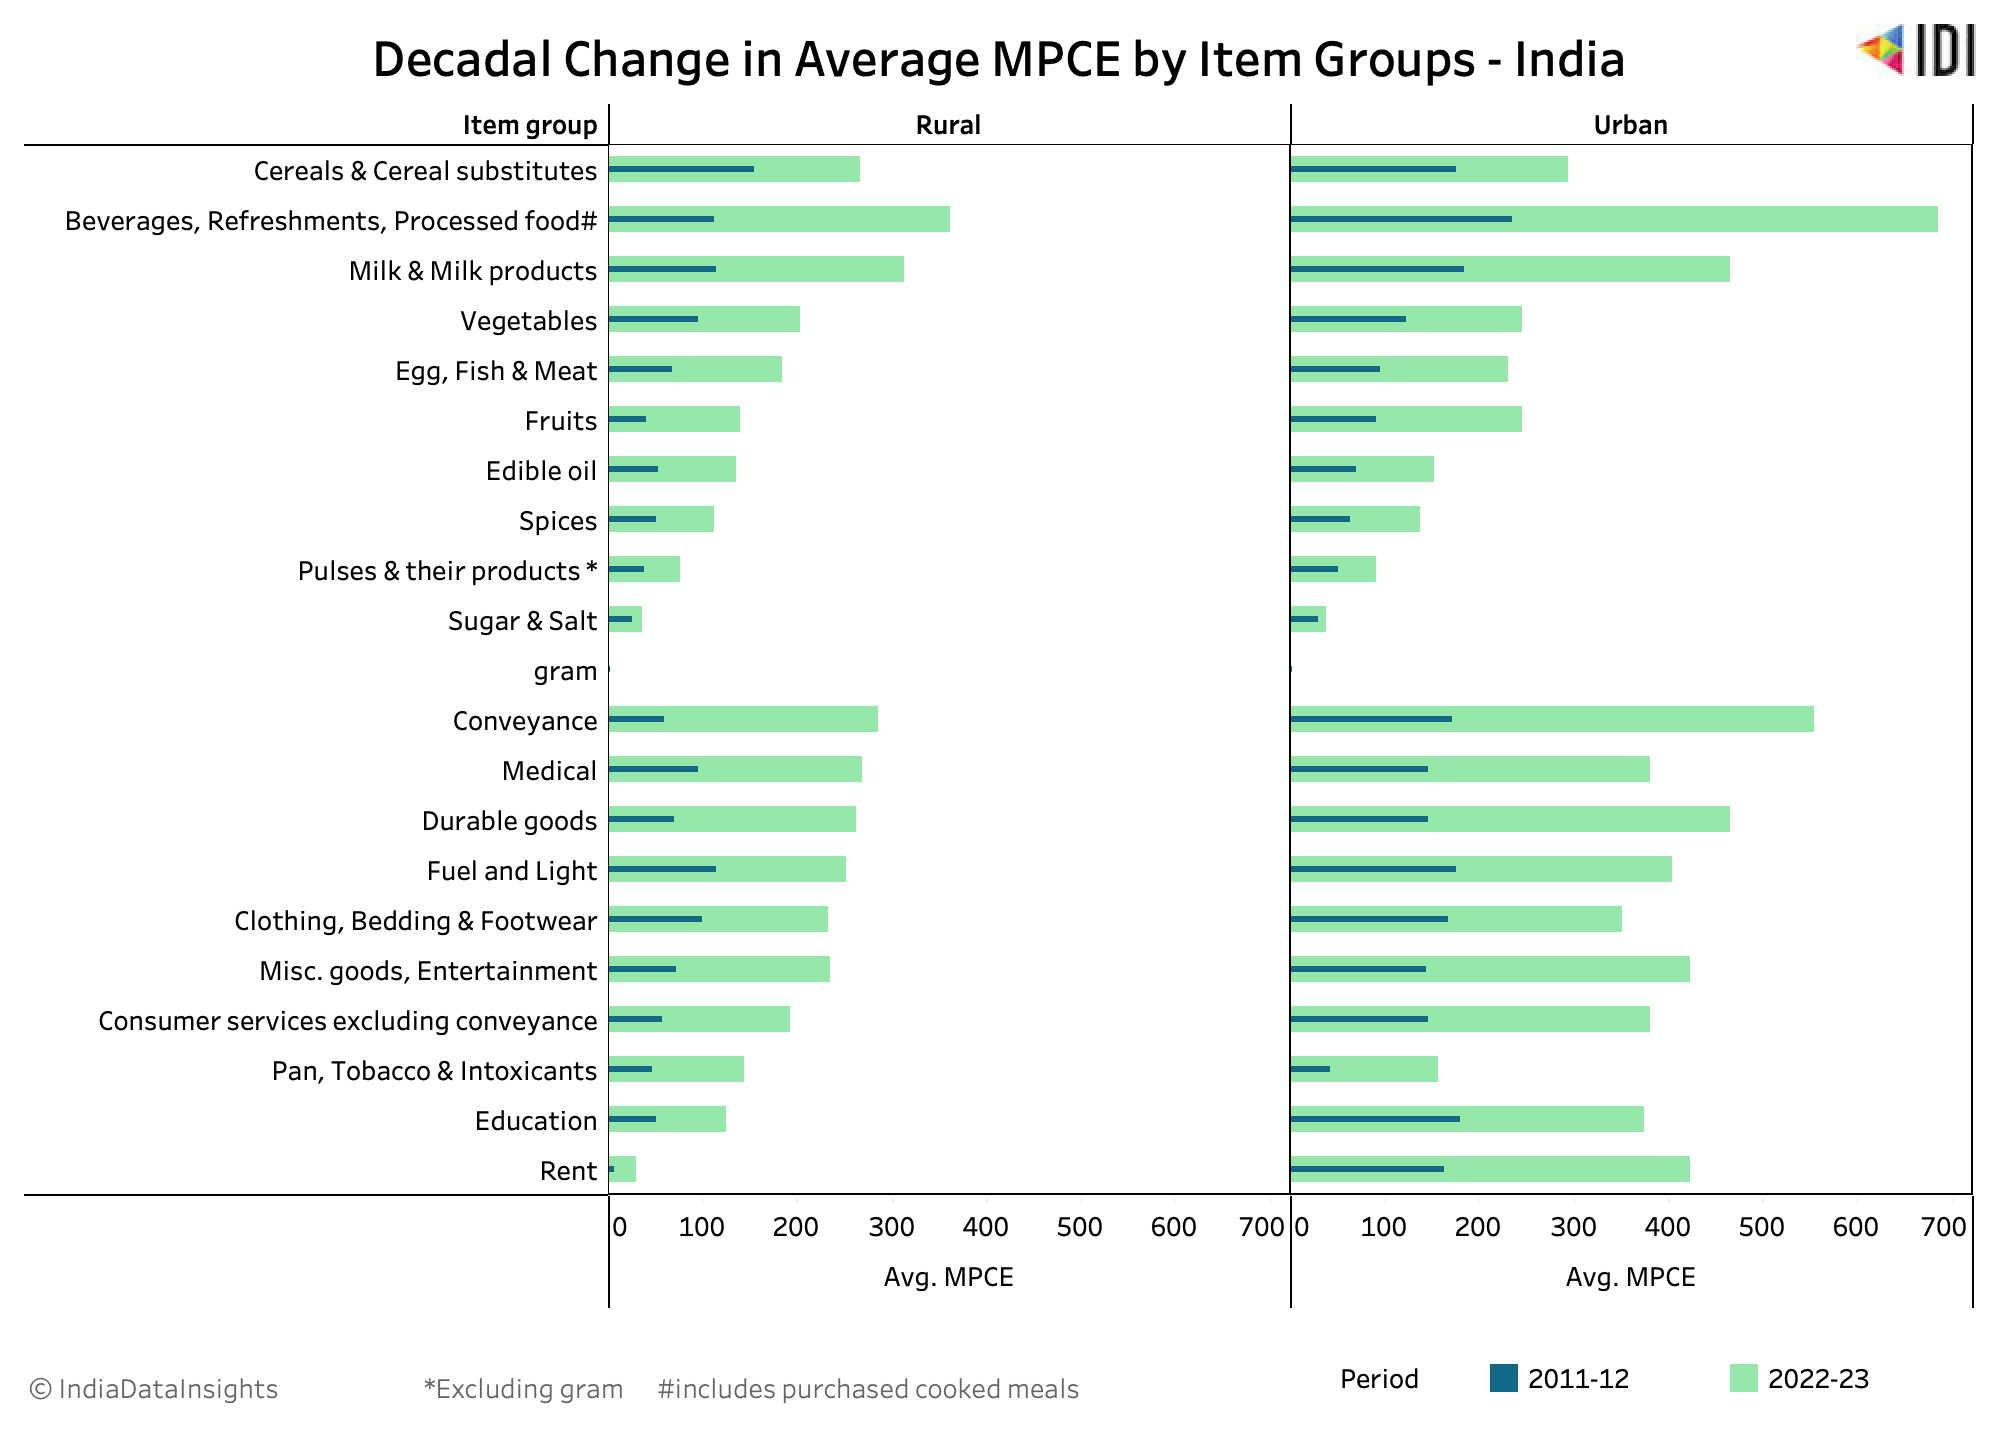 In the last decade (2011-12 to 2022-23), across rural and urban households, the average MPCE in absolute value has more than doubled for most items except Pulses & their products, Sugar and Salt.
The most significant shift, both in absolute value and percentage share of MPCE, has occurred in the item groups of Beverages, Refreshments, Processed food (BRPF), and Conveyance. Notably, for both of these item groups, the gap in MPCE value between urban and rural households was more than doubled in 2011-12. However, by 2022-23, this difference had narrowed to approximately 90%.
During this period, while the BRPF expenditure in rural households increased by INR 250, it increased by INR 451 in urban households. In terms of percentage share of MPCE, the BRPF in rural and urban households increased from 7.9% to 9.4% and 9% to 10.5%, respectively.
The percentage share of average MPCE on conveyance increased from 4.2% to 7.4% in rural households, translating to an INR 225 increase in absolute MPCE value. The average MPCE in urban households increased by INR 384 (6.5% to 8.5% in terms of percentage share of average MPCE).
While an increase in overall expenditures is inevitable, it's crucial to manage the increased expenses towards essential items like cereals, pulses, milk, vegetables, fruits, healthcare, and education. This is vital for maintaining the health and well-being of people in both rural and urban areas. Additionally, bridging the expense disparity among different regions and income groups is essential for ensuring sustained living across India.
In the last decade (2011-12 to 2022-23), across rural and urban households, the average MPCE in absolute value has more than doubled for most items except Pulses & their products, Sugar and Salt.
The most significant shift, both in absolute value and percentage share of MPCE, has occurred in the item groups of Beverages, Refreshments, Processed food (BRPF), and Conveyance. Notably, for both of these item groups, the gap in MPCE value between urban and rural households was more than doubled in 2011-12. However, by 2022-23, this difference had narrowed to approximately 90%.
During this period, while the BRPF expenditure in rural households increased by INR 250, it increased by INR 451 in urban households. In terms of percentage share of MPCE, the BRPF in rural and urban households increased from 7.9% to 9.4% and 9% to 10.5%, respectively.
The percentage share of average MPCE on conveyance increased from 4.2% to 7.4% in rural households, translating to an INR 225 increase in absolute MPCE value. The average MPCE in urban households increased by INR 384 (6.5% to 8.5% in terms of percentage share of average MPCE).
While an increase in overall expenditures is inevitable, it's crucial to manage the increased expenses towards essential items like cereals, pulses, milk, vegetables, fruits, healthcare, and education. This is vital for maintaining the health and well-being of people in both rural and urban areas. Additionally, bridging the expense disparity among different regions and income groups is essential for ensuring sustained living across India.