India’s Economy: A Growing but Challenging Landscape
India’s Economy: A Growing but Challenging Landscape
Published on :- August 3rd, 2023
A look at the growth trends of crucial economic indicators in IndiaDecent Work and Economic Growth (SDG 8) aims to achieve higher economic productivity levels through diversification and technological upgradation. Economic growth is one of SDG 8’s central tenets. Along with sustaining per capita economic growth, especially aiming for at least 7 per cent annual gross domestic product (GDP) growth in the least developed countries, is one of its key targets.
India's economy has emerged as one of the world's fastest-growing economies, witnessing consistent GDP growth in line with the SDG target and a more than doubled per capita GDP over the past decade. The COVID-19 pandemic has also adversely impacted the economy, further impeded by the country's widening trade deficit in recent years.
This edition of Data Dialogue explores the growth trends of crucial economic indicators in India, including GDP, per capita GDP, imports, exports, and Gross Value Added (GVA). Additionally, we dive into the role of the service and manufacturing sectors in India's economy.
Size of the Indian EconomyGross domestic product (GDP) is the standard measure of the value added. It is an indicator of the health of a national economy and economic growth. It represents the monetary value of all products and services produced in the country within a defined period.
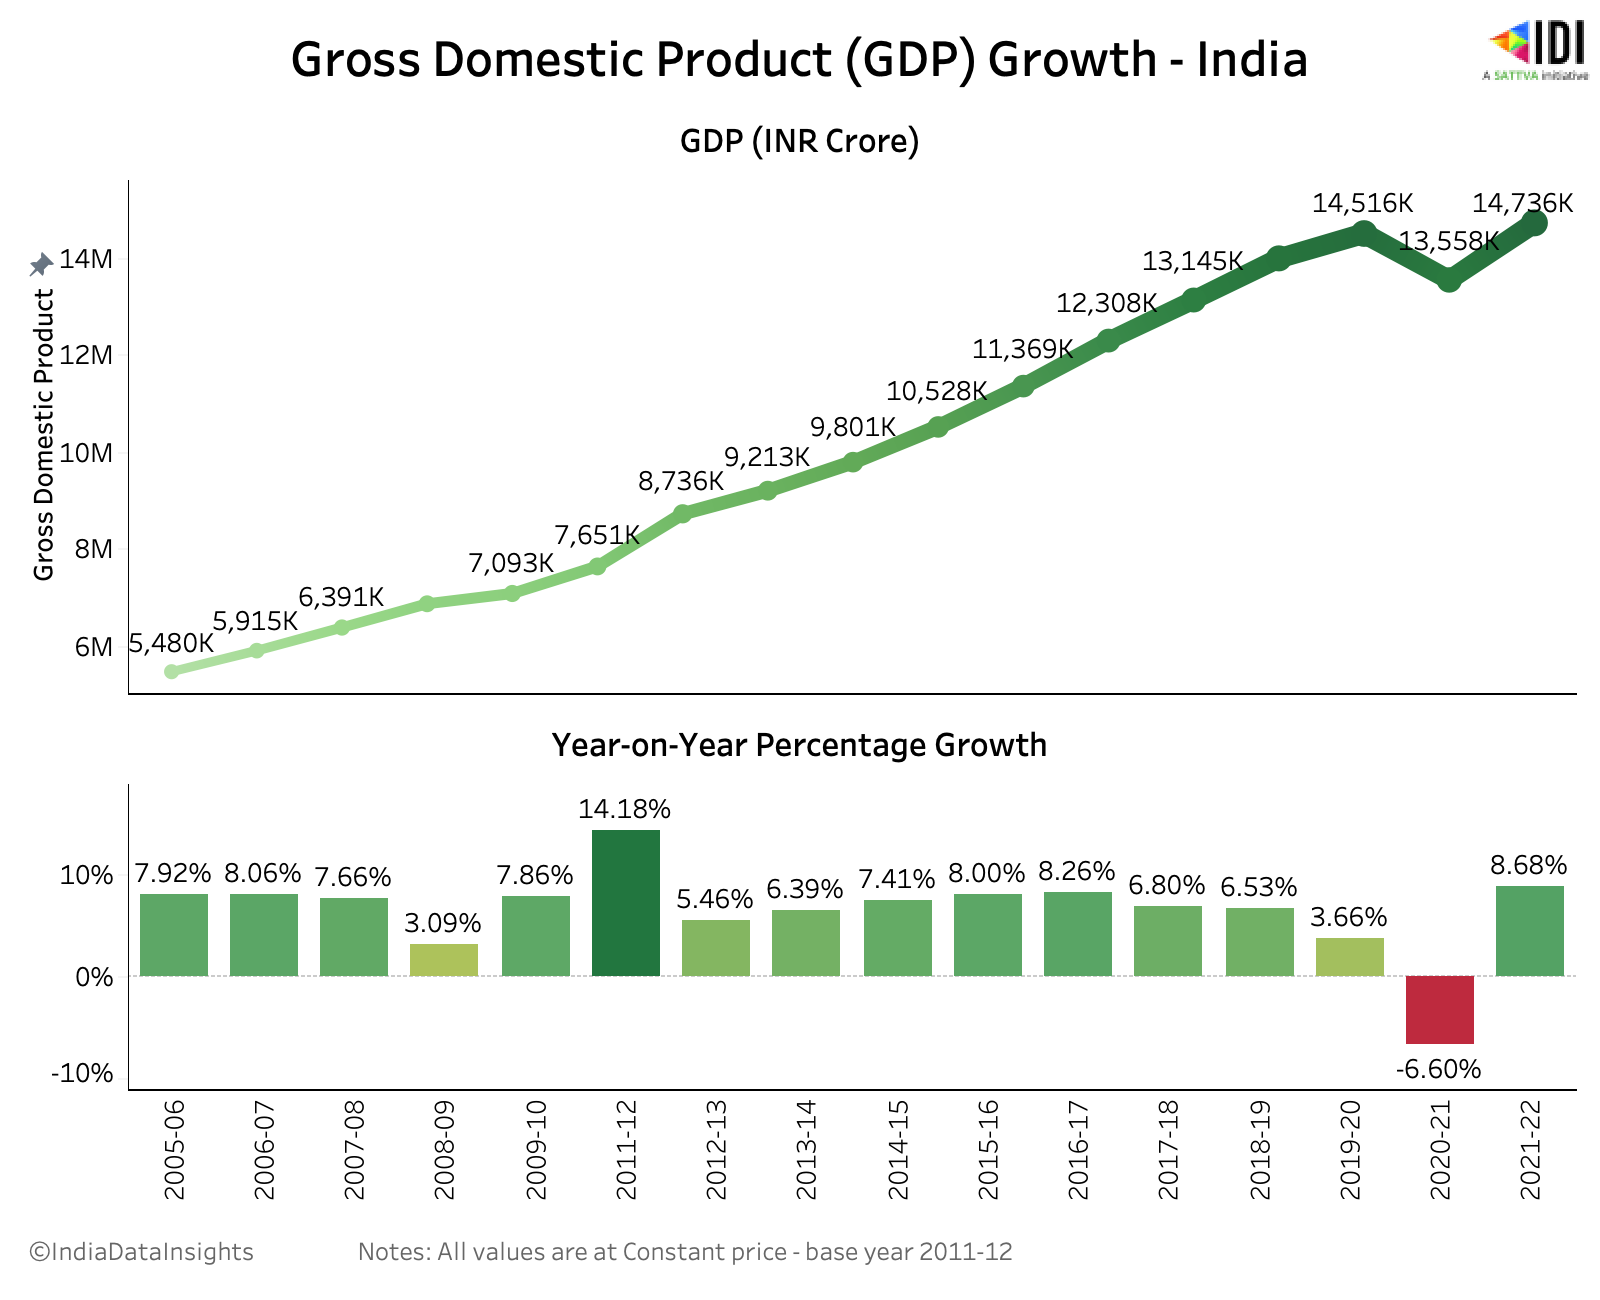
India’s Gross Domestic Product (GDP) at a constant price of 2011-12 for FY 2021-22 was at ~147 Lakh Crores. In the last decade, India’s GDP has grown consistently at 6-7%, in line with the SDG 8 target. The impact of COVID-19 can be seen during 2019-21, during which the growth dropped drastically and is now recovering.
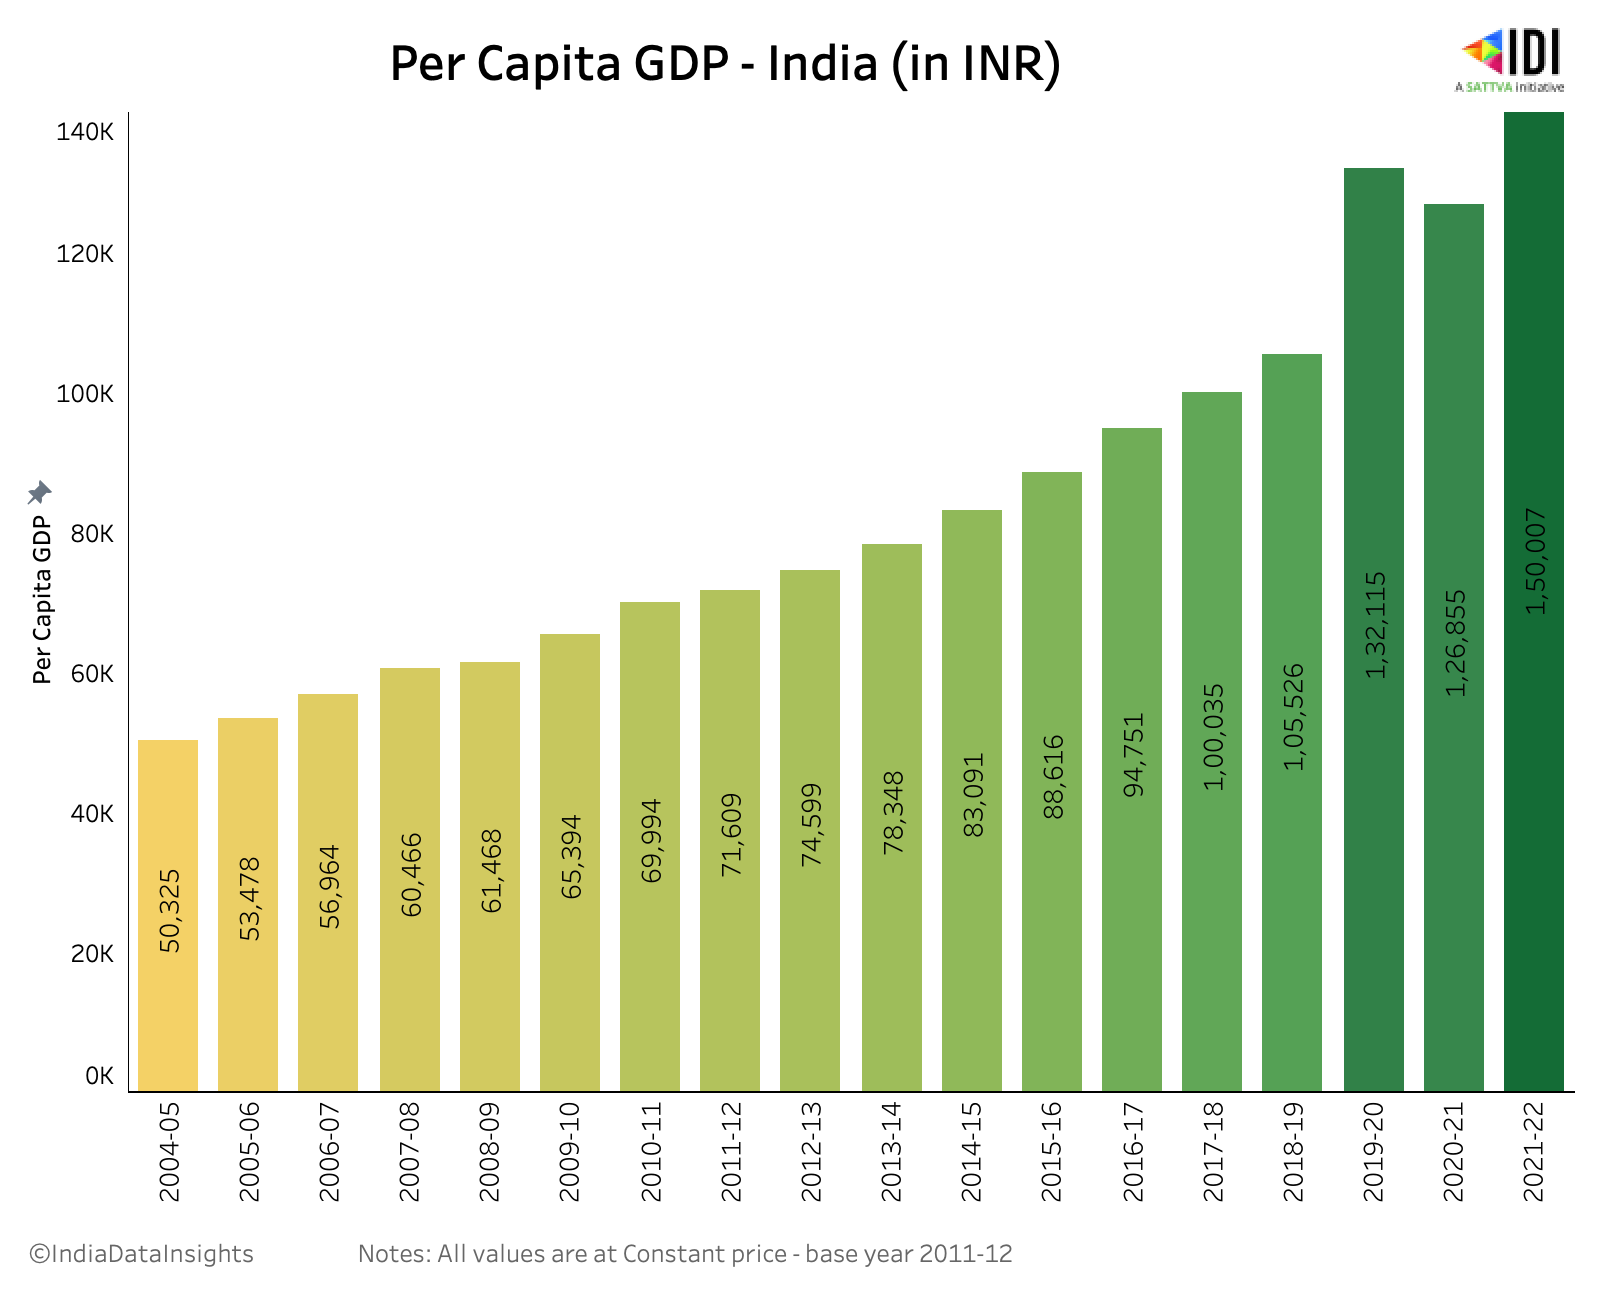
Similarly, per capita GDP has also seen consistent growth, doubling in the last decade (2012-22). In 2021-22, India’s per-cap GDP was INR ~1.5 Lakhs.
Various factors contribute to the economic growth of a country; exports and imports are one of them. If the imports exceed the exports, the country has a trade deficit which will negatively impact the country's trade balance and exchange rate.
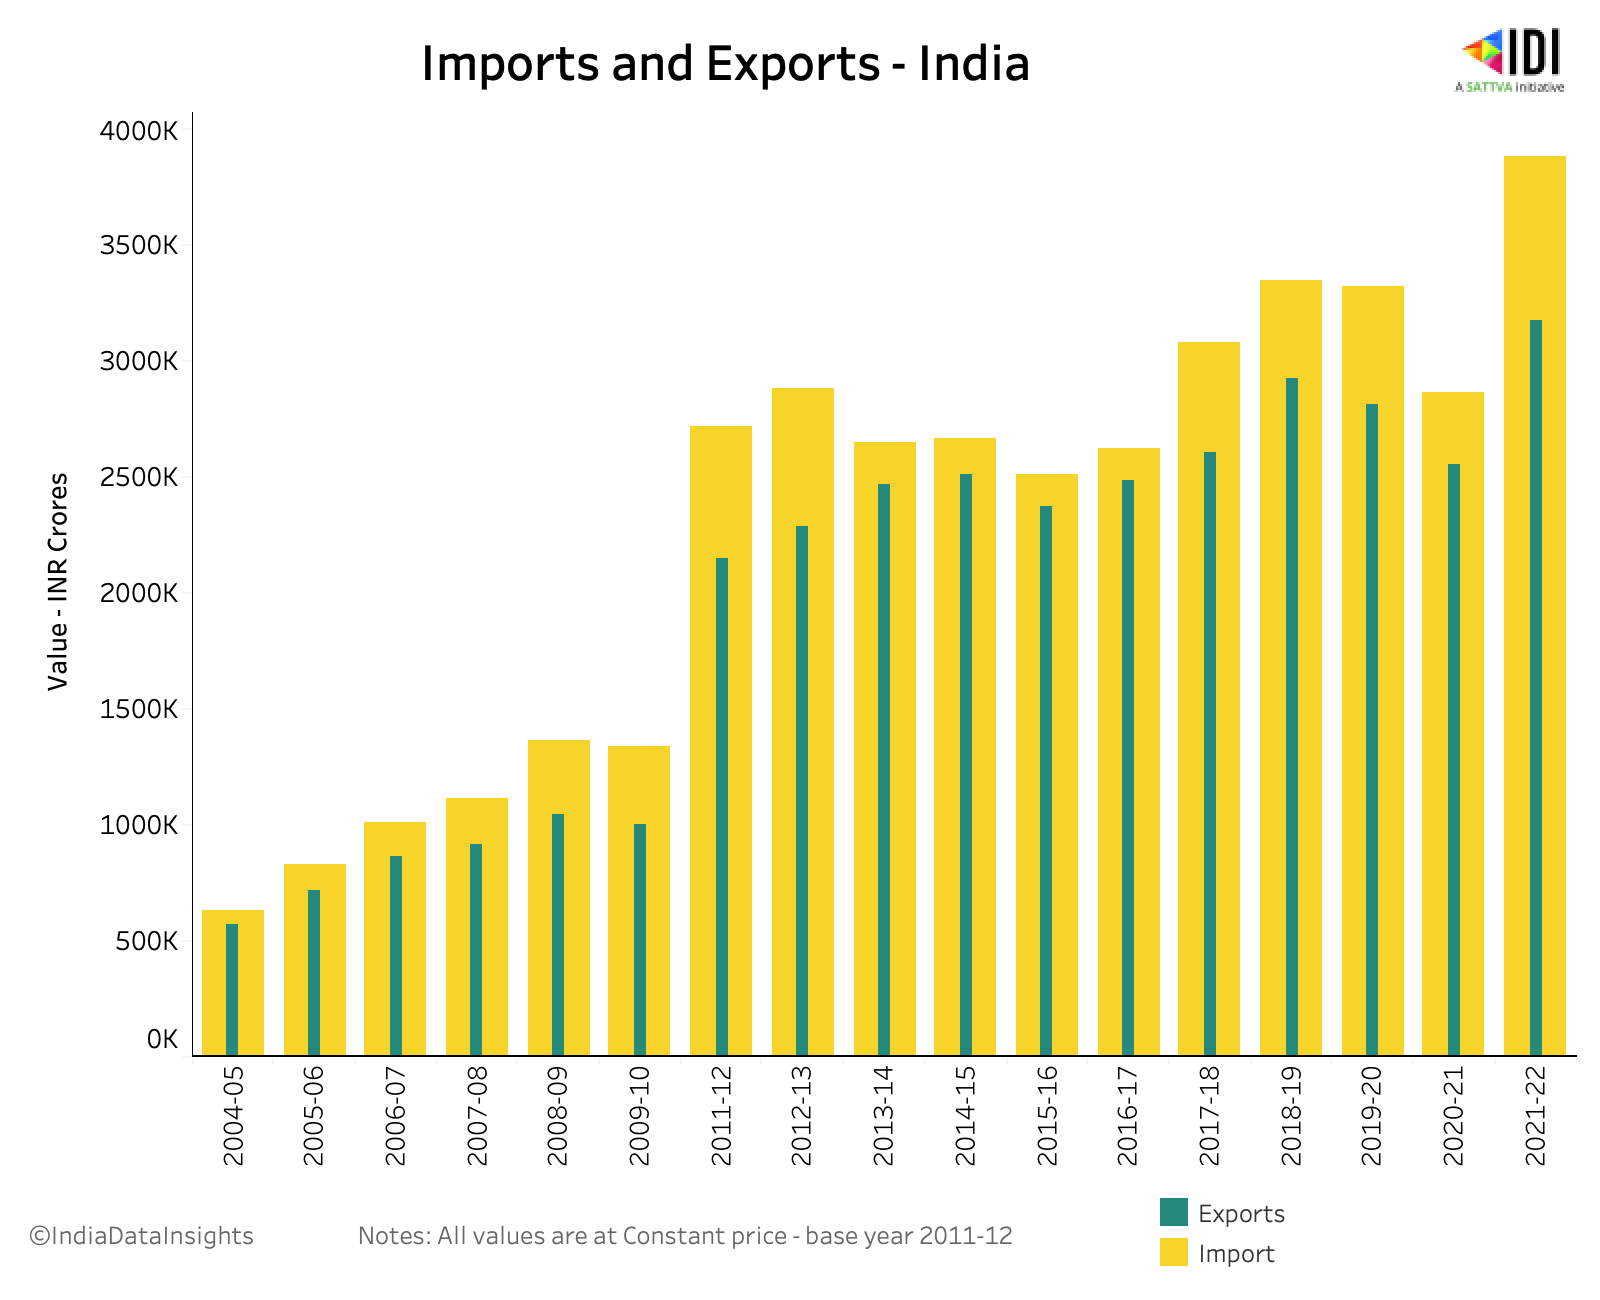
India’s import value at the constant price of 2011-12 has increased steadily since 2017-18. For the last five years, India’s import value has been around 400 - 500 thousand crores more than the export value. In FY 2021-22, India’s import value was 700 thousand crores more than the export value, leading to a widening trade deficit.
Economic Output of StatesAmong the States/UTs, Net State Domestic Product (NSDP), a measure of the economic output of a state, was highest for Goa and Delhi.
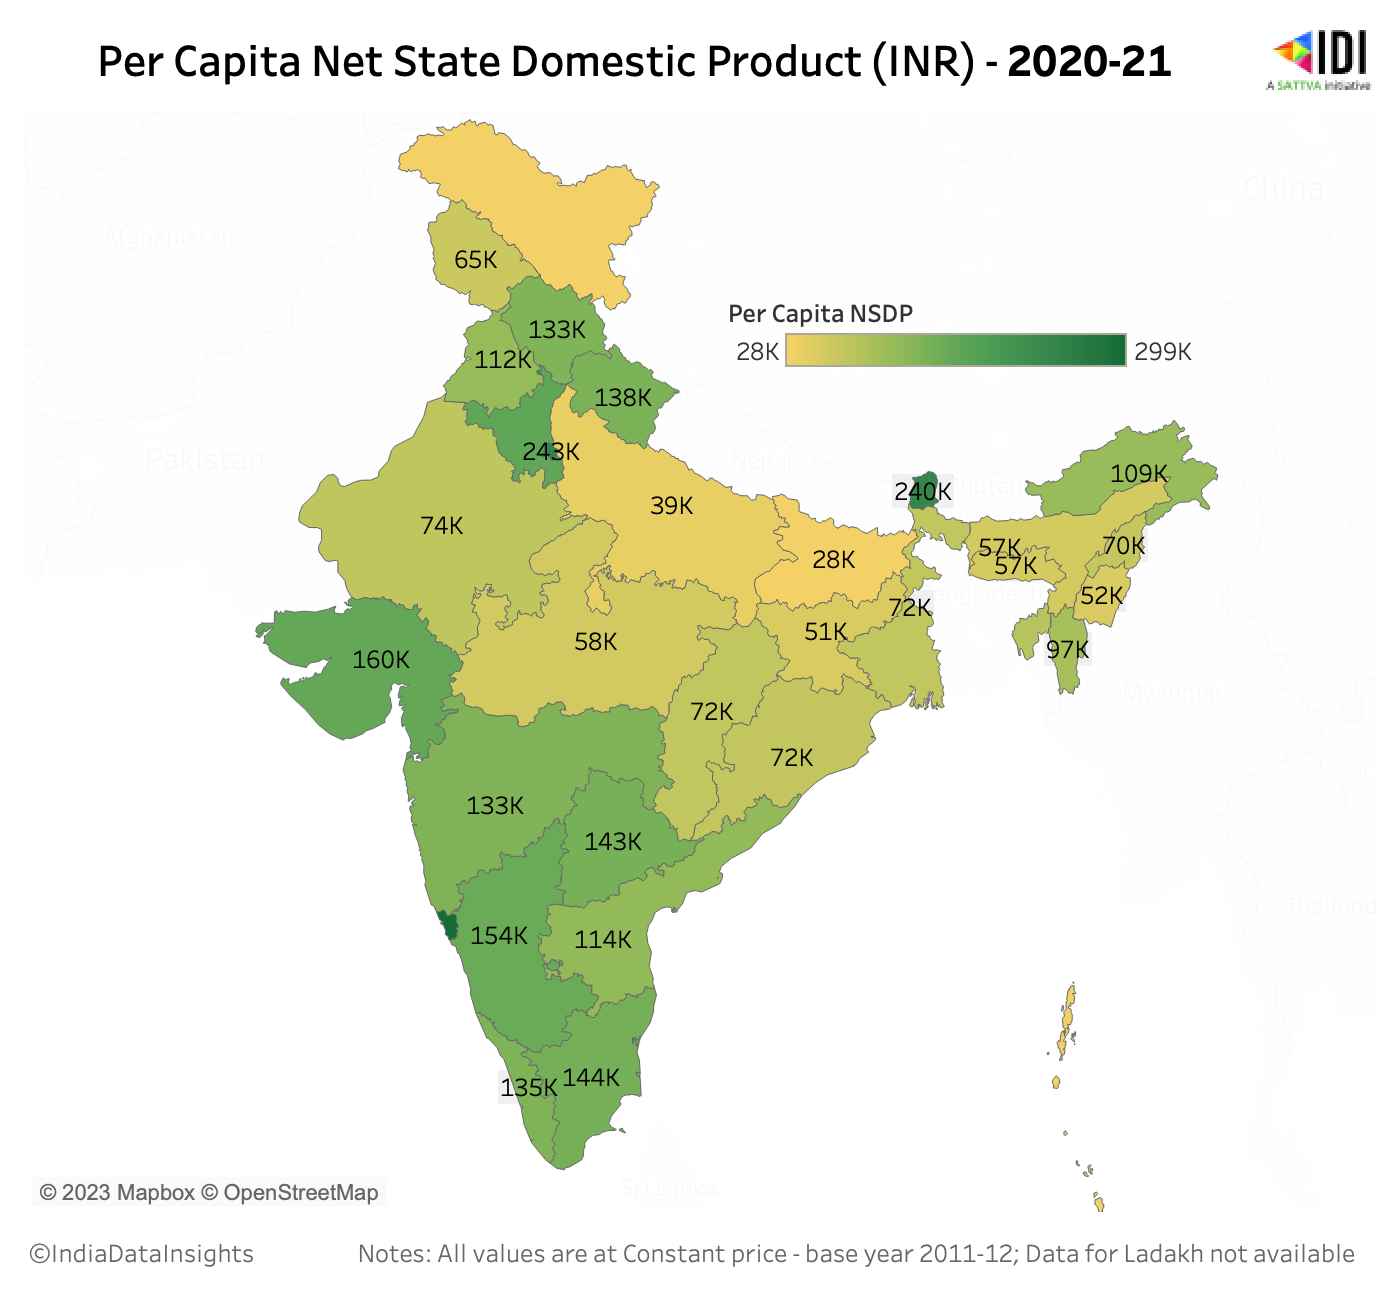
In FY 2020-21, NSDP for Goa was the highest at INR ~2.99 Lakh, followed by Delhi at INR ~2.43 Lakhs and Sikkim at ~2.40 Lakhs. Among the larger states, southern and south-western states have higher NSDP values. States of Gujarat, Karnataka, Tamil Nadu, Telangana, Kerala and Maharashtra have an NSDP value of more than INR 1.3 Lakh.
Sector contributionGross value added (GVA) is an economic productivity metric that measures the contribution of a corporate subsidiary, company, or municipality to an economy. GVA is an important measure, because it is used to determine GDP.
Alongside India's economic growth, the Gross Value Added has also increased in recent years. In FY 2021-22, approximately 2/3rd (~62%) of India’s GVA is from the service sector, followed by the Industrial sector, which contributes to 22% of GVA and Agriculture & allied sectors constitute more than 15%.
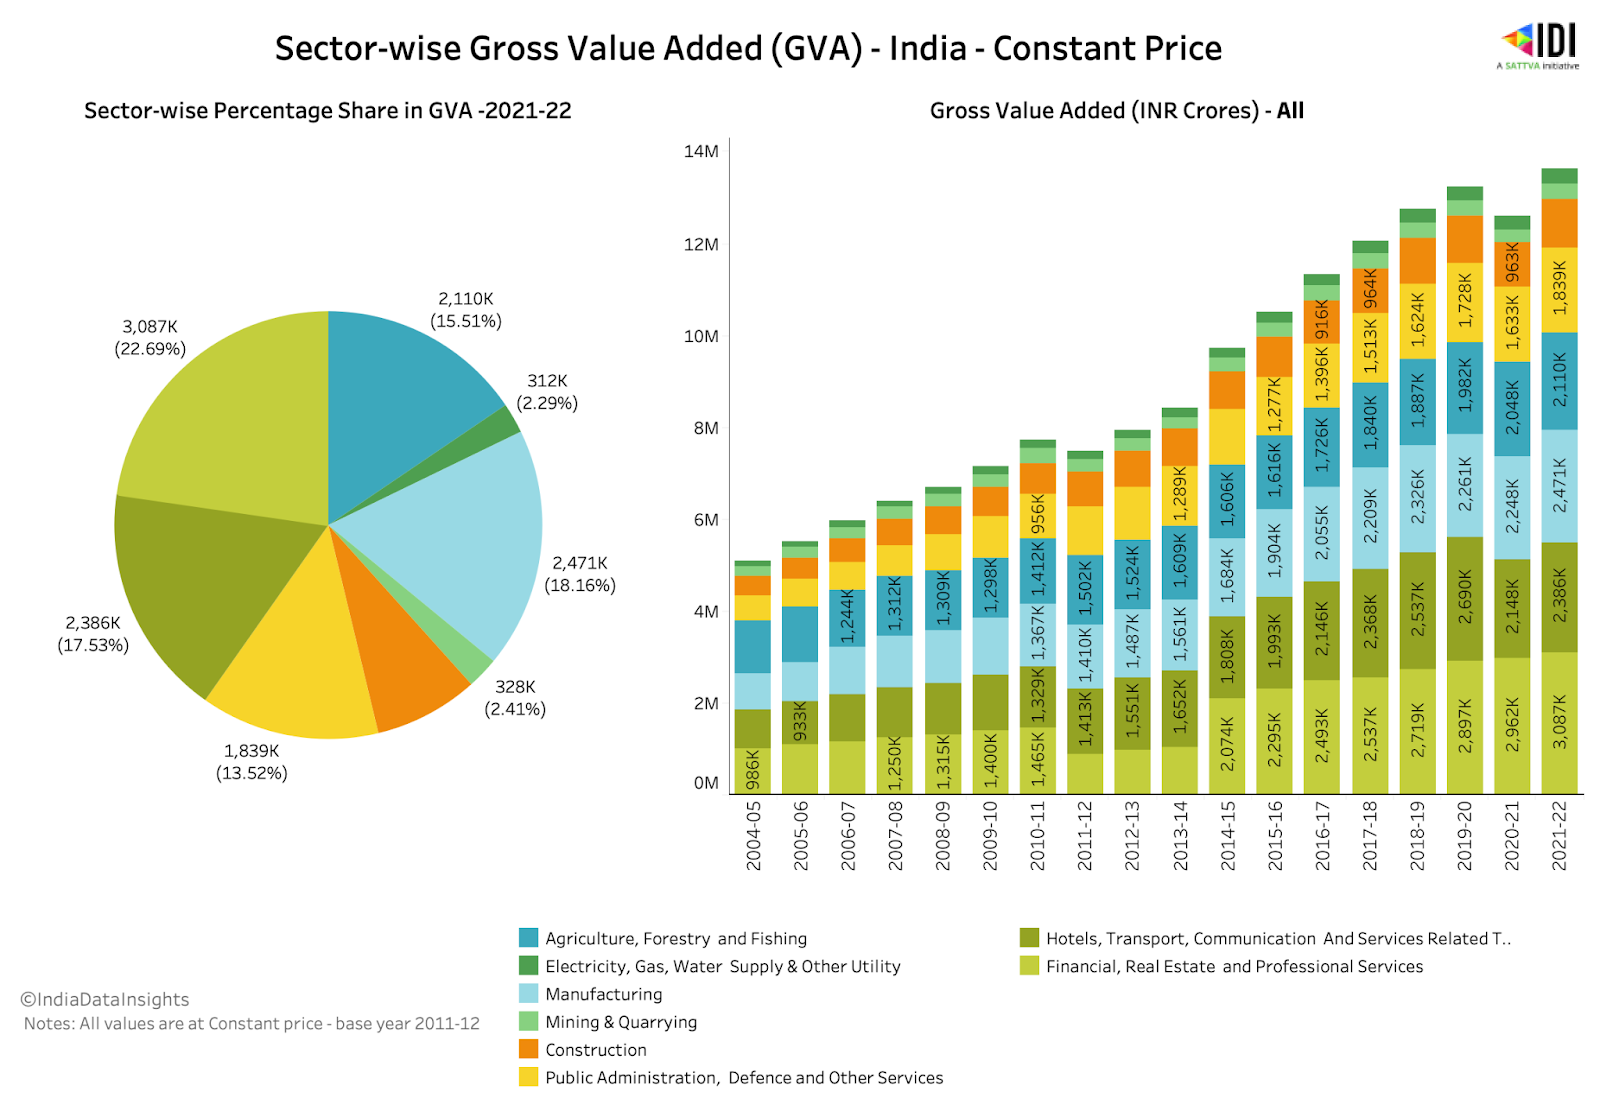
While sectoral share for most sectors has either remained constant or increased slightly, three sectors - Agriculture & allied sectors, construction and public administration and defence services have declined.
Clearly, the service sector plays a crucial role in contributing to the Indian economy's overall growth. However, among individual states, it is evident that the manufacturing sector emerges as a primary contributor to achieving high Net State Value Added (NSVA).
Net State Value Added (NSVA) signifies the Net Value Added by different states and union territories.
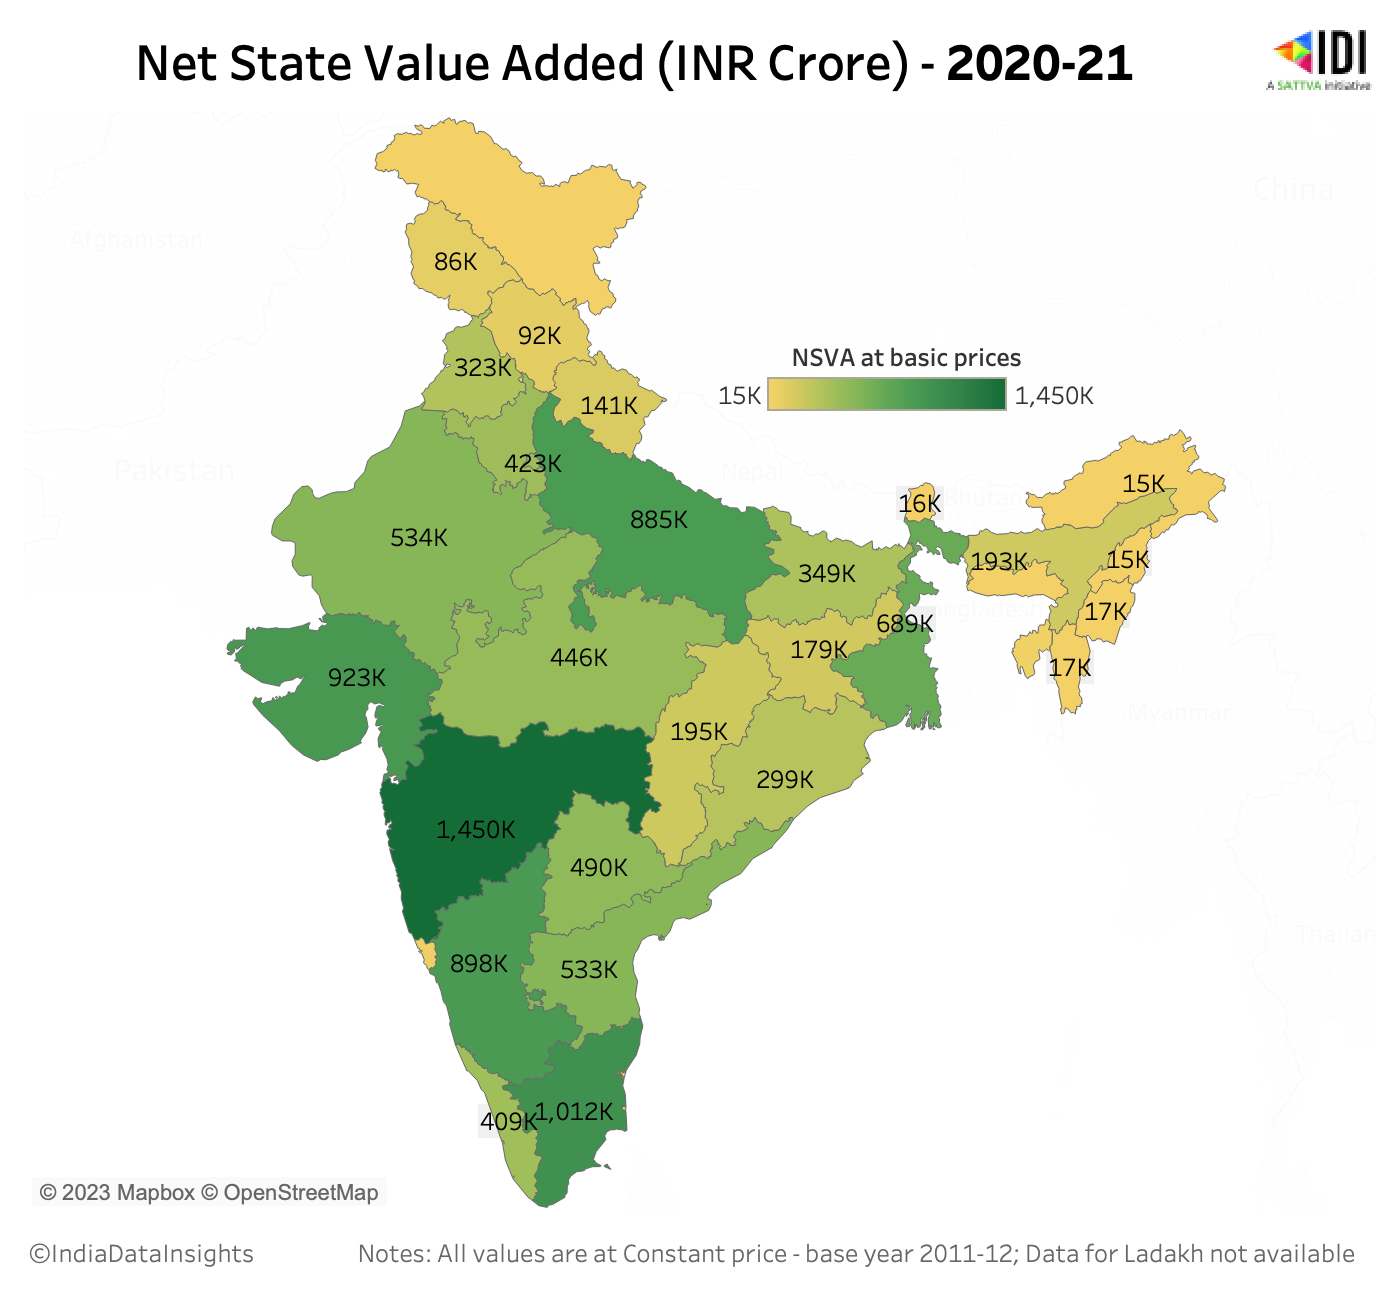
In FY 2020-21, among the states, Maharashtra contributed the highest with a value of 14.50 Lakh crores, followed by Tamil Nadu and Gujarat. In all these three states, manufacturing was a significant contributor to high NSVA. 1/3rd, 1/4th and 1/5th is the contribution from the manufacturing sector to NSVA for the states of Gujarat, Tamil Nadu and Maharashtra, respectively.
India has made considerable progress in achieving economic growth and improving various economic indicators. However, it also highlights the need for continued efforts and recovery from the COVID-19 pandemic, as well as policy measures to address challenges like widening trade deficits and sectoral declines while aiming to achieve sustained and inclusive economic growth in line with the goals of SDG 8.
For more details, explore India Data Insights