-
- This document is an electronic record in terms of (i) Information Technology Act, 2000; (ii) the rules framed there under as applicable; and (iii) the amended provisions pertaining to electronic records in various statutes as amended by the Information Technology Act, 2000. This electronic record is generated by a computer system and does not require any physical or digital signatures.
-
- This document is published in accordance with the provisions of Rule 3 (1) of the Information Technology (Intermediaries guidelines) Rules, 2011 that require publishing the rules and regulations, privacy policy and terms of use for access or usage of Our website indiadatainsights.com (“Portal”).
-
- The Portal is owned, registered and operated by “Sattva Media and Consulting Private Limited” (“Sattva”), a private limited company having its place of business at #294/295, 2nd Floor, Amar Jyothi Layout, Domlur, Bangalore - 560071, Karnataka, India.
-
- These terms of usage (“Terms of Use”) read along with the Privacy Policy constitute a legal and binding agreement between you and Sattva and govern Your use of the Portal and Services (as defined below) provided through the Portal. By using or visiting the Portal, or by using any content or information provided as part of the Portal/Services, You shall be deemed to have read, understood and accepted to be bound by these Terms of Use.
-
- For the purpose of these Terms of Use, wherever the context so requires "You", “Your”, “User” or “Customer” shall mean any natural or legal person who uses the Portal for availing the Services. The terms “We”, “Us”, “Our” shall mean Sattva.
-
- We reserve the right to make changes to these Terms of Use at any time. Any such modifications will become effective immediately upon posting on the Portal and Your continued use of the Portal, and/or the Services constitutes Your agreement to such modifications. You agree to periodically review the current version of these Terms of Use as posted on the Portal.
-
- Users who are “competent/capable” of contracting within the meaning of the Indian Contracts Act, 1872 shall be eligible to access or use the Portal. Users who are minors are not eligible to access Our Portal or obtain Our Services. Sattva reserves the right to terminate Your account and/or refuse to provide You with access to the Services if it is discovered that You are under the age of 18 (eighteen) years or any information provided by You is inaccurate. You may not access or use the Portal if We have previously banned You from the Portal or closed Your account.
-
- You will have to be a registered User of the Portal in order to avail all of the Services on the Portal. You will have to open an account by completing the registration process by providing Us with current, complete and accurate basic information such as Your first name, last name and email address as promoted by the registration page (“Questionnaire”). You shall also choose a password and a user name for Your account (“User Account”). We reserve the right to make changes to the questions in the Questionnaire at any point and such changes will be notified to You via e-mail or on the Portal. The manner in which we collect, use, store or disclose Your personal information and sensitive personal information collected on the Portal, if any, has been outlined in our Privacy Policy available here.
-
- Upon completion of the registration process, You will be provided with an account tab on the Portal. You may amend/change Your information associated with Your User Account, by logging into Your User Account on the Portal.
-
- You shall be responsible for maintaining the confidentiality of Your username, account password and You shall be responsible for any and all activities that occur in connection with Your User Account. Under no circumstances shall Sattva be liable for any loss or damage arising from Your failure to comply with this clause.
-
- While creating Your User Account, You agree to provide complete and accurate information about Yourself. You may not impersonate any third party to create or use an account for anyone other than Yourself OR provide an email address other than Your own OR create multiple accounts.
-
- You shall not allow: (a) any other person to share Your User Account; (b) any part of the Portal being cached in proxy servers and accessed by individuals who have not registered as Users of the Portal; and (c) access to the Portal through a single account and password being made available to multiple users on a network.
-
- The Portal is an online platform which aggregates and makes available government published data-sets sourced from various government departments and ministries including but not limited to census data, data from NITI Aayog, and data from data.gov.in (“Secondary Data”). Sattva also analyses and interprets such Secondary Data and provide its own unique insight after interpreting and analysing the data on the Portal (“Insight Data”). In addition to the Insight Data, Sattva makes available certain digital content in the form of ready-to-use info-graphics, dashboards, reports etc. on the Portal (“Products”). Secondary Data, Insight Data and the Products shall be jointly referred to as “Content” and the provision of the Content through the Portal shall be referred to as “Services” for the purpose of this Terms of Use.
-
- All Users will be able to access and download Content available freely on the Portal without payment of any subscription fees. However, certain Content and Services will be available only to Users who have subscribed to the Services on payment of the subscription fees specified on the Portal from time to time. Notwithstanding anything else contained in this Terms of Use, the manner in which Sattva provides the Content on the Portal shall be subject to change at its sole discretion.
- Terms and Conditions with respect to the Provision of Services
-
- We grant you a non-exclusive, non-transferable, restricted, revocable and limited right to use Insight Data and/or the Products only for your personal use in accordance with this Terms of Use. The same shall not be used for any commercial purposes.
-
- You must comply with all applicable copyright and other laws in connection with your access to and use of the Insight Data and/or the Products. You shall not redistribute, transmit, assign, sell, broadcast, rent, share, lend, sublicense or otherwise transfer the Insight Data and/or the Products, unless otherwise allowed under this Terms of Use. We do not grant You any synchronization, public performance, promotional use, commercial sale, resale, reproduction, rental or distribution rights in the Insight Data and/or the Products made available on the Portal. You may however, use, alter, modify, create derivative works of the Insight Data and/or the Products for internal purposes subject to attribution as per Clause 4.5 below.
-
- You shall not violate the copyright and any other intellectual property rights in the Insight Data made available on the Portal by any means and for any purpose. You acknowledge that Sattva derives its rights to use the Insight Data and other materials offered on the Portal from industry experts, consultants and such other third parties. You further acknowledge that Sattva shall have the ownership and all rights in such Insight Data and/or Products and You shall not infringe the rights of Sattva in any manner, including without limitation, reverse engineering, decompiling, disassembling or otherwise tampering with such Insight Data and/or Products.
-
- You shall not create any derivative works of any nature of the Insight Data without the prior written consent of Sattva, if such derivative works are meant for commercial use.
-
- All Insight Data accessed and used by You shall be attributed by You to Sattva in the manner provided below:
“Source: (URL of the Portal)”
-
- Usage of Secondary Data: The government facts and figures (as well as Indian government-authored reports) cited or quoted on the Portal are not subject to copyright or other intellectual property right protections in India, unless otherwise explicitly provided. The Secondary Data is, therefore, free to be used by You in any manner to use, adapt, publish, translate, make derivative work of for any lawful commercial and non-commercial purpose. While We do not insist on attribution with respect to the Secondary Data made available on the Portal, we recommend that while publishing any Secondary Data accessed by You through this Portal shall be attributed by You to the government as well as Sattva in the manner provided below:
“[Name of Data Provider], [Year of Publication], [Name of Data], [Name of Data Repository/Website], [Version Number and/or Date of Publication (dd/mm)], [DOI / URL /URI]. Accessed through [URL of the Portal]”
-
- Further, You agree that You will not in any way:
-
-
- interfere with the ability of others to access or use the Portal and the Services;
-
-
- disrupt the normal flow of communication or otherwise act in a manner that adversely affects other users' ability to use the Portal or the Services;
-
-
- claim a relationship with or to speak for any individual, business, association, institution, or other organization for which You are not authorized to claim such a relationship;
-
-
- interfere with or disrupt the Services or servers or networks connected to the Services, or disobey any requirements, procedures, policies, or regulations of networks connected to the Services;
-
-
- upload or post or use the Service to transfer, any content or other material that contains or constitutes viruses, Trojan or other code with malicious, disruptive and/or destructive features;
-
-
- You shall not attempt to gain unauthorized access to any hardware or software systems or networks associated with the Service, or obtain any services or information not intentionally made available to You by Sattva on or through the Service; and
You shall not attempt to gain unauthorized access to the account of any other user or entity, or otherwise interfere with any other user's or entity's use of the Service.
-
- Please note that the credit card / debit card / net banking payment gateway is maintained, operated and processed by the online payment gateway services provider(s) (“OPGSPs”) engaged by Sattva. You agree and acknowledge that Sattva bears no responsibility for payment made by credit card /debit card /net banking to avail the Service(s) through the Portal. Further, You hereby agree to comply with any other additional terms and conditions that may be prescribed by the OPGSPs for processing the online payments made by You on the Portal. Sattva is not liable for any actions under this payment mechanism.
-
- You understand, accept and agree that the payment facility provided by Sattva is neither a banking nor financial service. You further agree that while availing any of the payment options as specified above, We will not be responsible or assume any liability whatsoever in respect of any loss or damage arising directly or indirectly to You due to: (a) lack of authorization for any transactions; or (b) any payment issues arising out of the transaction; or (c) decline of such transaction for any reason.
-
- You agree, understand and confirm that the credit card / debit card / net banking details provided by You for availing of the Services through the Portal shall be correct and accurate and You shall not use the credit card / debit card / net banking account which is not lawfully owned by you, i.e. in a credit card / debit card / net banking transaction, You must use Your own credit card / debit card / net banking account. You further agree and undertake to provide the correct and valid credit card / debit card / net banking account. Further, the said information will not be utilised and shared by Sattva with any third parties unless required for fraud verifications or by law, regulation or court order. Sattva shall not be liable for any credit card / debit card / net banking account fraud. The liability for use of a credit card / debit card / net banking account fraudulently shall be on You and the onus to “prove otherwise” shall be exclusively on You.
-
- Sattva has exercised due care and attention to ensure accurate description and pricing of Services that are being offered through the Portal. However, despite Our best efforts, certain Services offered via the Portal may be mispriced or the description of the Services may be inaccurate. Sattva does not and cannot confirm the price of the Services until You place an order to avail such Services through the Portal. In the event, the Services offered via the Portal are mispriced or the description of the Services is inaccurate, Sattva shall have the right, at its sole discretion, to refuse or cancel any orders placed by You for such Services. In the event the Services are incorrectly priced, Sattva may, at its discretion, either contact You for instructions or cancel Your order and notify You of such cancellation. Sattva shall have the right to modify the price of such Services at any time at its sole discretion and contact You for further instructions using the e-mail address provided by You while registering onto the Portal or cancel the order and notify You of such cancellation. Sattva shall not be liable at any time for any such error or omission with regard to the pricing and/or description of the Services offered via the Product.
-
- Prices for Services displayed on Our Portal are provided in Indian rupees. The pricing and/or availability of Services shall be subject to change at the sole discretion of Sattva, without providing any notice to the Users.
-
- Fees once paid through OPGSPs shall not be refunded except in case of multiple times debiting of a User’s Card/Bank Account due to a technical error OR User's account being debited with excess amount in a single transaction due to a technical error. In such cases, the aggrieved User will have to make an application to the Grievance Officer for refund along with the transaction number and original payment receipt if any, generated at the time of making payments. The application will be processed manually. If after verification, the claim is found valid, the amount received in excess will be refunded within a period of 15 working days.
- Intellectual Property Rights
-
-
- All content included on the Portal and delivered to Users as part of the Services, including but not limited to the Product, text, articles, photographs, images, illustrations, info-graphics, video material, audio material, and software used on or incorporated into the Portal, is the property of Sattva, and is protected by the applicable intellectual property laws. The compilation of all content on this Portal is the exclusive property of Sattva. You agree not to decompile, reverse engineer or disassemble any content accessible through the Portal, not to insert any code or product or manipulate the content of the Portal in any way that affects the User's experience, and not to use any data mining, data gathering or extraction method. We reserve the right to terminate our engagement if We, in our sole and absolute discretion, believe that You are in violation of this clause.
-
-
- Sattva’s content available on or via the Portal, are provided to You “as is” for Your information and personal use only and may not be used, copied, reproduced, distributed, transmitted, broadcast, displayed, sold, licensed, or otherwise exploited for any other purposes whatsoever without the prior written consent of Sattva. Sattva reserves all rights, not expressly granted in and to the Portal.
Indiadatainsights.com and indiadatainsights.in are the registered domains of Sattva. The Portal, including, but not limited to its text, graphics, logos, the name ‘Sattva’ along with the tagline ‘Delivering High Impact’, “Data Insights”, “India Data Insights”, “IDI”, “IDI RealChart”, “IDI Interact”, “IDI Collective”, button icons, images, scripts and service names constitute trade marks/trade dress of Sattva. The trademarks, domain names and trade dress of Sattva shall not be used in connection with any product or service that is not affiliated with Sattva in any manner that is likely to (a) cause confusion among Users or potential Users; or (b) dilute the rights of Sattva; or (c) to disparage or discredit Sattva.
-
- The government facts and figures (as well as Indian government-authored reports) cited or quoted on the Portal are not subject to copyright or other intellectual property right protections in India, unless otherwise explicitly provided. The other content of this Portal (including the Product, text, articles, photographs, images, illustrations, info-graphics, video material, audio material, and software the) and all materials for which a source citation is not provided, however, are protected by copyright, trademark and other laws of India. This Intellectual Property is owned or controlled by Sattva or the party credited as the source of the Intellectual Property. In addition, Sattva owns all the intellectual property rights to this Portal available to it under the various laws of India.
- User Feedback/Comments/Suggestions
-
- We encourage Users to submit/ post/ share their comments/ suggestions/ opinions/ feedback etc. (“User Feedback”) with Us.
-
- The User agrees and acknowledges that:
- The User Feedback does not contain any confidential information or is not in violation of any third party right including intellectual property rights;
- The User Feedback shall not be unlawful, obscene, defamatory, libellous, threatening, pornographic, harassing, hateful, racially or ethnically offensive, or is otherwise inappropriate as under Applicable Law.
- We are not under any obligation of confidentiality, express or implied, regarding the User Feedback;
- We reserve the right to use or disclose such User Feedback for any purpose, in any way, as We deem fit;
- We are not obligated to review the User Feedback; and
- We reserve the right to reject, remove, delete or edit such User Feedback, at any time, without any reason, without providing any notice.
- Limitation and Disclaimer of Warranty
-
- Sattva does not guarantee the accuracy of the government data on this Portal and You rely on such information at Your own risk. You should double-check all government data referenced on this Portal by examining the sources cited.
-
- The Portal, the Services and each portion thereof are provided “as is” without warranties of any kind either express or implied. To the fullest extent possible pursuant to Applicable Laws of India, We disclaim all warranties, express or implied, with respect to the Portal, the Services and the Product and each portion thereof, including, but not limited to, accuracy of the data sourced from the government websites and used to create the Product. Any error of the government data and the resultant error in the Insight Data and/or the Product shall not be attributable to Sattva and You shall not make a claim for any loss, if any, on account of Your reliance on the Insight Data and/or the Product and the government data that is used to develop it.
For the purpose of this Terms of Use, “Applicable Law” shall mean, any statute, law, regulation, ordinance, rule, judgment, notification, rule of common law, order, decree, bye-law, government approval, directive, guideline, requirement or other governmental restriction, or any similar form of decision of, or determination by, or any interpretation, policy or administration, having the force of law of any of the foregoing, by any authority in India having jurisdiction over the matter in question, whether in effect as of the date of these Terms of Use or thereafter.
-
- Under no circumstances shall Sattva or any others involved in creating this Portal and its contents be liable for any damages or injury, including any direct, indirect, incidental, special, consequential, punitive or other damages resulting from any circumstance involving this Portal or its contents (including but not limited to damages or injury caused by error, omission, interruption, defect, failure of performance, misdirected or redirected transmissions, failed internet connections, unauthorized use of this Portal, lost data, delay in operation or transmission, breach of security, line failure, defamatory, offensive or illegal conduct of any user of this Portal, or computer virus, worm, trojan horse or other harmful component), even if You have advised Sattva in advance of the possibility of such damage.
-
- Sattva does not warrant or make any representations regarding the Product on this Portal in terms of their timeliness, correctness, accuracy, reliability, or otherwise. While Sattva makes reasonable efforts to provide accurate and timely information on this Portal, You should not assume that the information provided is always up-to-date or that this Portal contains all the relevant information available. We undertake no obligation to verify or maintain the currency of such information.
-
- If You are dissatisfied with the Services and/or Products provided on the Portal, You may terminate these Terms of Use in accordance with Clause 10 below.
-
- Sattva does not guarantee that the Portal will function without interruption or errors in functioning. In particular, the operation of Portal may be interrupted due to maintenance updates, or system or network failures. In the event of interruption in accessing the Portal due to the above mentioned reasons, Sattva shall inform the User of the same, and Sattva disclaims all liability with respect to delay in provision of Services due to the same.
-
- You agree to indemnify, defend and hold harmless Sattva, and Our affiliates, officers, partners, employees, consultants and representatives, from and against all losses, expenses, damages, costs, claims and demands, including reasonable attorney's fees and related costs and expenses, due to or arising out of: (a) Your failure to comply with these Terms of Use; or (b) where any information You submit, email, or otherwise transmit to Us violates third party rights or applicable laws. We reserve the right, at our own expense, to assume the exclusive defence and control of any matter otherwise subject to indemnification by You, and in such case, You agree to fully cooperate with such defence and in asserting any available defences.
-
- Sattva may terminate these Terms of Use immediately without notice in the event of any breach by You of these Terms of Use or any of our applicable policies, as posted on the Portal from time to time or upon a misuse of the Services by You.
-
- You may terminate these Terms of Use, for any or no reason, at any point in time for any Product yet to be consumed by You. You acknowledge that for Product already consumed by You, these Terms of Use will continue to apply.
-
- In the event of any termination or expiration of these Terms of Use, the following sections of these Terms of Use shall survive: all provisions regarding ownership of intellectual property, indemnification, disclaimer of warranties and limitations of liability, and the provisions of this section.
-
- You agree that upon the termination of these Terms of Use, We may delete all information related to You with respect to the Services availed by You.
If any part of the Terms of Use are determined to be invalid or unenforceable pursuant to applicable laws of India, including, but not limited to, the warranty disclaimers and liability limitations set forth above, then the invalid or unenforceable provision will be deemed to be superseded by a valid, enforceable provision that most closely matches the intent of the original provision and the remainder of the Terms of Use shall continue in effect.
Unless otherwise specified herein, these Terms of Use constitute the entire agreement between you and Sattva in respect of the Product and supersedes all previous written and oral agreements between you and Sattva, if any. Sattva’s failure to act with respect to a breach by You or others does not waive its right to act with respect to subsequent or similar breaches.
- Governing Law and Dispute Resolution
These Terms of Use shall be governed by and constructed in accordance with the applicable laws of India without reference to conflict of laws principles. The courts in Bangalore, India shall have the exclusive jurisdiction to determine any disputes arising in relation to, or under these Terms of Use.
In accordance with the Information Technology Act, 2000 and rules made there under, the name and contact details of the Grievance Officer are provided below:
Name: Mr. Sansiddha Pani.
Address: #294/295, 2nd Floor, Amar Jyothi Layout, Domlur, Bangalore - 560071
E-mail ID: sansiddha.pani@sattva.co.in
 MPI is a score and is measured on a scale of 0 to 1. Based on NFHS 4 data, India’s MPI score is 0.118, which translates to - for every 100 citizens, approximately 12 of them are multidimensionally poor. MPI is calculated based on two factors – Headcount ratio (How many are poor?) and Intensity of poverty (How poor are the poor?).
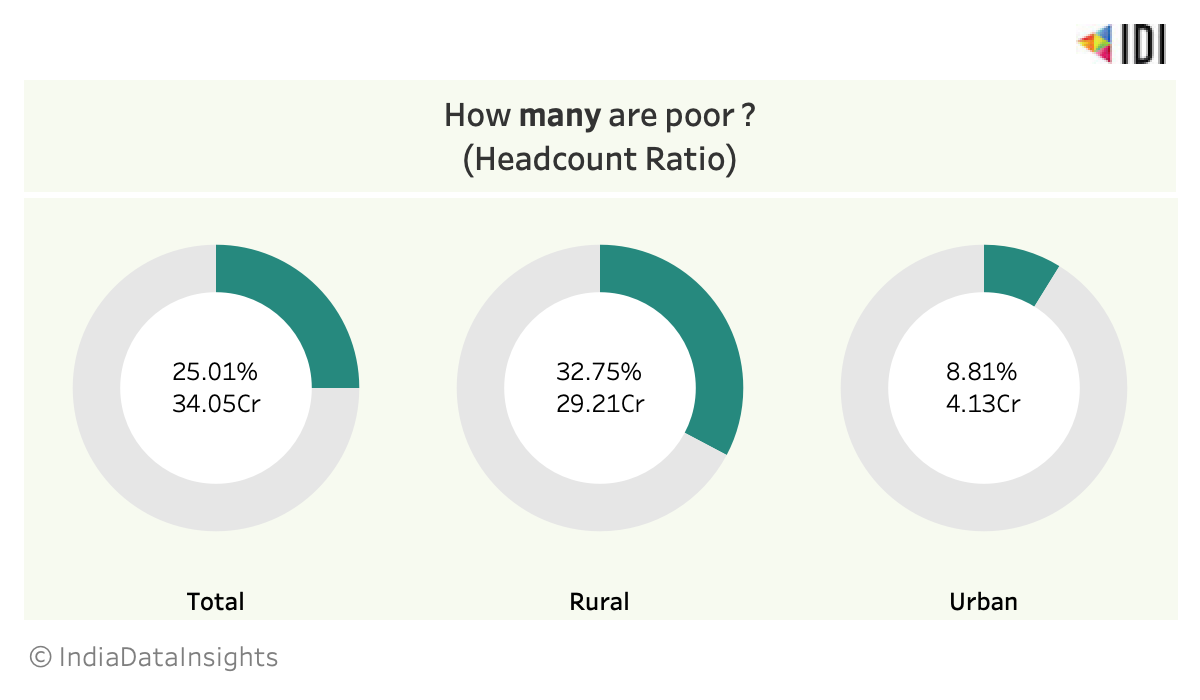 The headcount ratio is the proportion of the population that lives below the poverty threshold. Approximately 1/4th of India’s total population (~34 crores) and almost 1/3rd of India’s rural population (~29 crores) lives below the poverty threshold.
 Among the 1/4th (~34 crores) population identified as poor, ~47.13% are deprived across various indicators marking the depth of poverty which is the intensity of poverty.
MPI provides a high-level view of the level of multidimensional poverty and its change with time due to its robust and dynamic nature. If a multidimensionally poor household overcomes any deprivation, the MPI score comes down even if they are still identified as multidimensionally poor.
Among the 1/4th (~34 crores) population identified as poor, ~47.13% are deprived across various indicators marking the depth of poverty which is the intensity of poverty.
MPI provides a high-level view of the level of multidimensional poverty and its change with time due to its robust and dynamic nature. If a multidimensionally poor household overcomes any deprivation, the MPI score comes down even if they are still identified as multidimensionally poor.
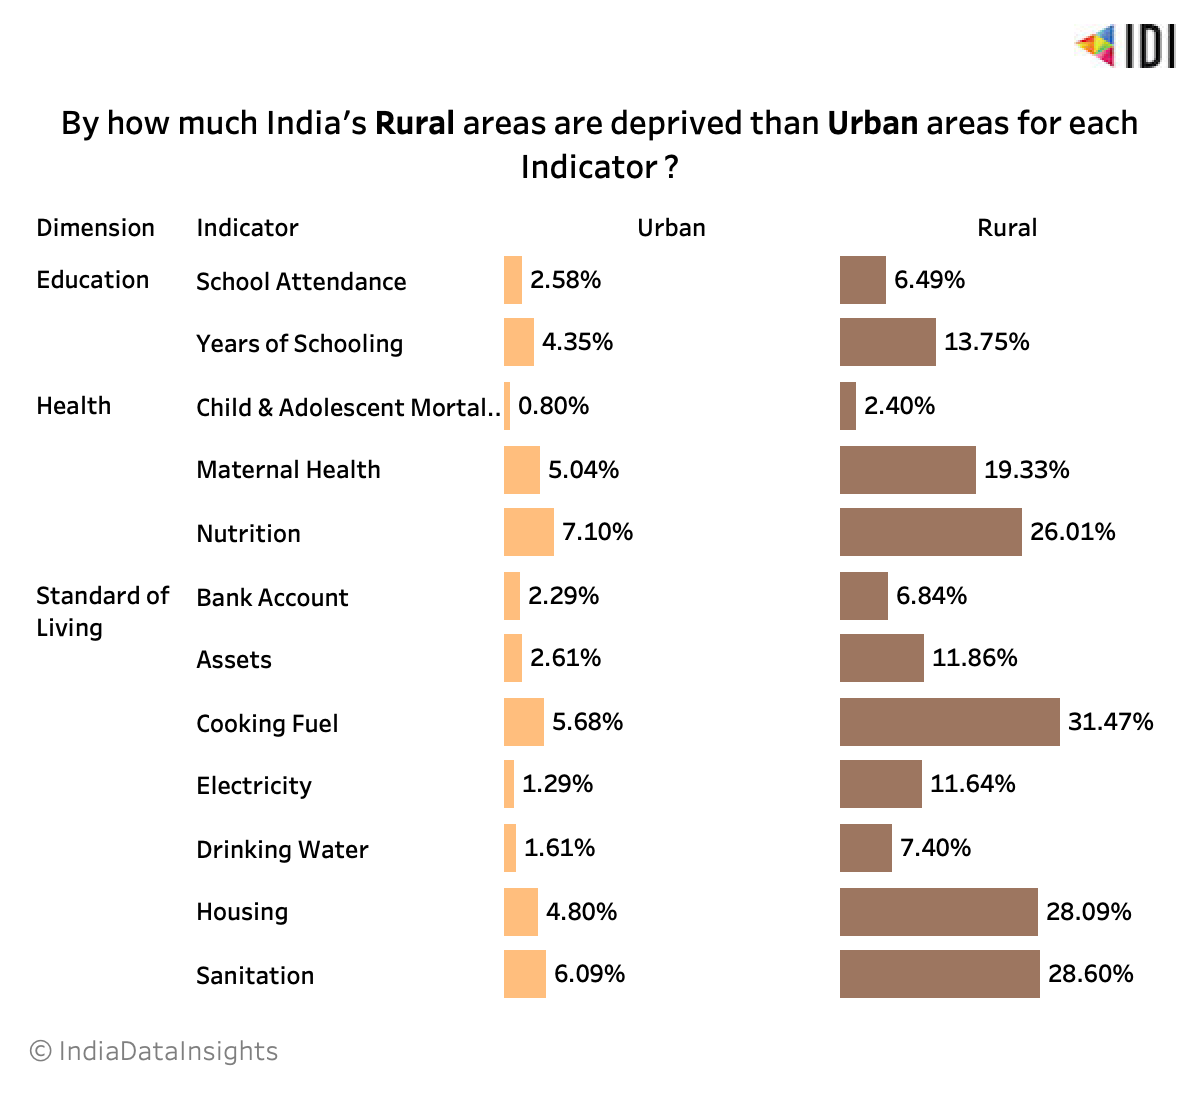 India’s rural population is more significantly deprived than the urban population in every indicator. A higher share of the rural population is deprived of some of the basic key indicators such as years of schooling, nutrition, access to clean cooking fuel, drinking water, sanitation, housing and electricity etc.
Which state of India is Performing Better or Worse with respect to MPI?
A closer look into key indicators such as years of schooling, nutrition and cooking fuel shows that the proportion of the population who are multidimensionally poor and are deprived in that indicators at the same time(censored headcount ratio) is lesser in smaller states such as Kerala, Goa and Himachal Pradesh than the large state such as Uttar Pradesh, Madhya Pradesh, Bihar and Jharkhand.
India’s rural population is more significantly deprived than the urban population in every indicator. A higher share of the rural population is deprived of some of the basic key indicators such as years of schooling, nutrition, access to clean cooking fuel, drinking water, sanitation, housing and electricity etc.
Which state of India is Performing Better or Worse with respect to MPI?
A closer look into key indicators such as years of schooling, nutrition and cooking fuel shows that the proportion of the population who are multidimensionally poor and are deprived in that indicators at the same time(censored headcount ratio) is lesser in smaller states such as Kerala, Goa and Himachal Pradesh than the large state such as Uttar Pradesh, Madhya Pradesh, Bihar and Jharkhand.
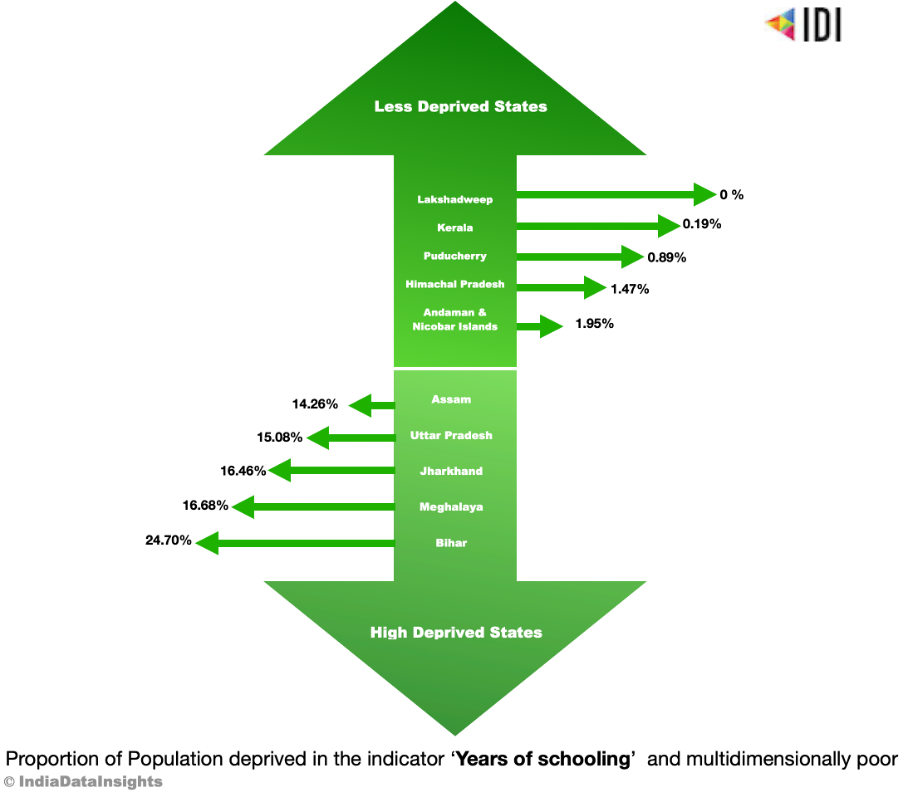 The lowest deprivation in the Years of Schooling indicator is seen in the states of Kerala(0.19%) and Himachal Pradesh(1.47%). The highest deprivation is found in the state of Bihar(24.70%).
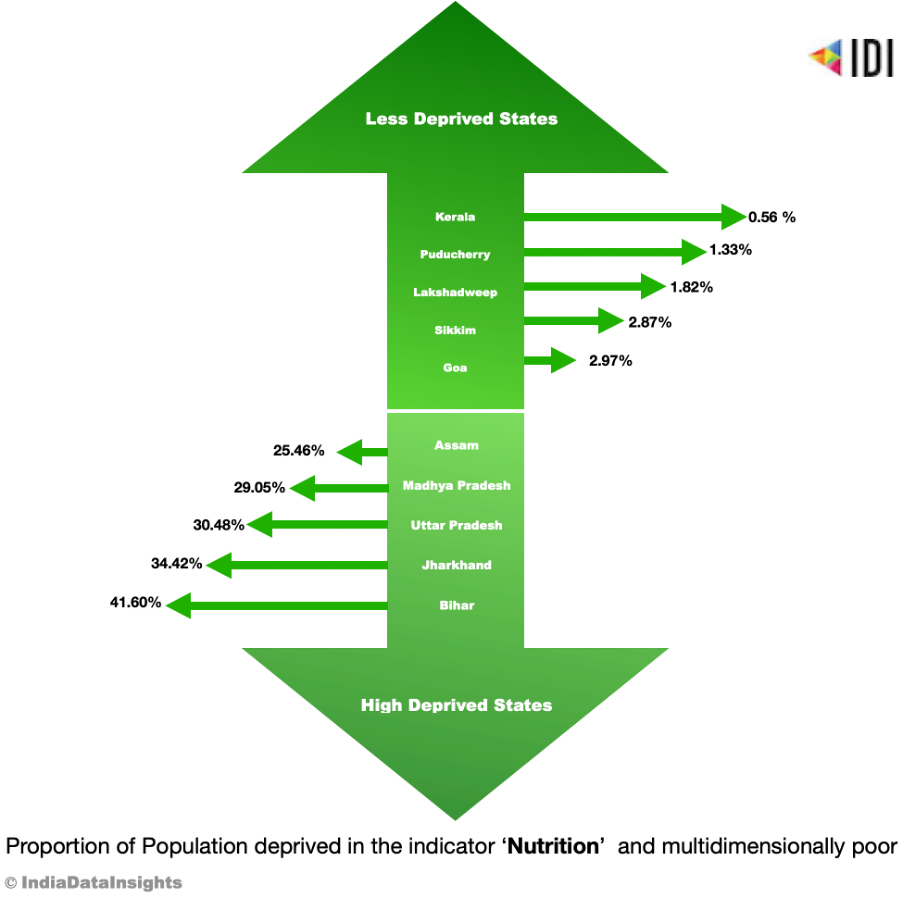 For the Nutrition indicator of Health Dimension, States like Kerala(0.56%), Sikkim(2.87%) and Goa(2.97%) are managing their respective states well. Assam (41.70%) is the most deprived state, with 41.60% population being deprived in the Nutrition indicator, followed by Madhya Pradesh(34.42%) and Uttar Pradesh(30.48%).
 For the Cooking Fuel indicator, despite the availability of various cooking fuels, Major parts of the states like Bihar(50.20%), Jharkhand(41.25%), Madhya Pradesh(34.90%), Uttar Pradesh(34.26%), and Meghalaya(31.82%) have limited access to cooking fuel.
SDG 2 includes targets aimed at reducing the proportion of men, women and children of all ages living in poverty, by at least half. MPI presents an overall picture of poverty and helps to monitor the state of poverty across states and districts. This helps make informed evidence-based interventions, thereby ensuring no one is left behind.
How do you think India is progressing towards reduced poverty compared to the rest of the world?
For more details, check out the interactive dashboard - Multidimensional Poverty in India
For the Cooking Fuel indicator, despite the availability of various cooking fuels, Major parts of the states like Bihar(50.20%), Jharkhand(41.25%), Madhya Pradesh(34.90%), Uttar Pradesh(34.26%), and Meghalaya(31.82%) have limited access to cooking fuel.
SDG 2 includes targets aimed at reducing the proportion of men, women and children of all ages living in poverty, by at least half. MPI presents an overall picture of poverty and helps to monitor the state of poverty across states and districts. This helps make informed evidence-based interventions, thereby ensuring no one is left behind.
How do you think India is progressing towards reduced poverty compared to the rest of the world?
For more details, check out the interactive dashboard - Multidimensional Poverty in India