SDG-6 Clean Water & Sanitation
SDG-6 Clean Water & Sanitation
Published on :- December 5th, 2022
As per UN Sustainable Development Report 2021, India is ranked 125th in the world for Clean water and Sanitation, receiving a score of 56.13.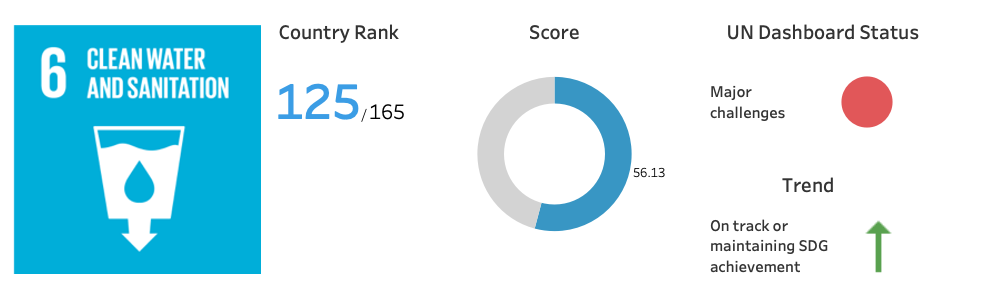 Among the 17 SDGs, for India, Clean Water and Sanitation is one of the focus areas on track to achieve its SDG goal, despite significant challenges remaining. Some of the goals India has identified in this sector are:
- By 2030, achieve universal and equitable access to safe and affordable drinking water for all
- By 2030, achieve access to adequate and equitable sanitation and hygiene for all and end open defecation, paying special attention to the needs of women and girls and those in vulnerable situations
- By 2030, improve water quality by reducing pollution, eliminating dumping and minimizing release of hazardous chemicals and materials, halving the proportion of untreated wastewater and substantially increasing recycling and safe reuse globally
- By 2030, substantially increase water-use efficiency across all sectors and ensure sustainable withdrawals and supply of freshwater to address water scarcity and substantially reduce the number of people suffering from water scarcity
- By 2030, implement integrated water resources management at all levels, including through transboundary cooperation as appropriate
- By 2030, protect and restore water-related ecosystems, including mountains, forests, wetlands, rivers, aquifers and lakes
- By 2030, expand international cooperation and capacity-building support to developing countries in water- and sanitation-related activities and programmes, including water harvesting, desalination, water efficiency, wastewater treatment, recycling and reuse technologies
- Support and strengthen the participation of local communities in improving water and sanitation management
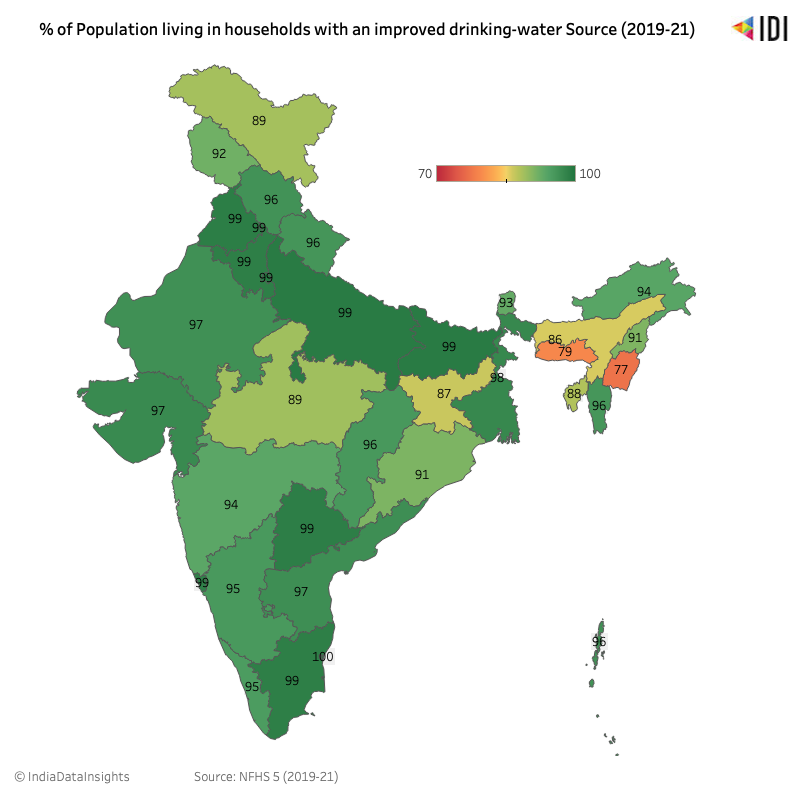 The latest National Family Health Survey (NFHS 5 2019-20) shows that over 90% of households in India have access to improved drinking water, with Puducherry having the best access to drinking water at 100%. With ten states at 99%, more states have access to improved drinking water than in 2016 (NFHS-4). Despite the increase in numbers, North-eastern India continues to lag behind- 77% of households in Manipur have access to an improved drinking water source, compared to 42% in 2016.
Access to Safe Drinking Water Ladder
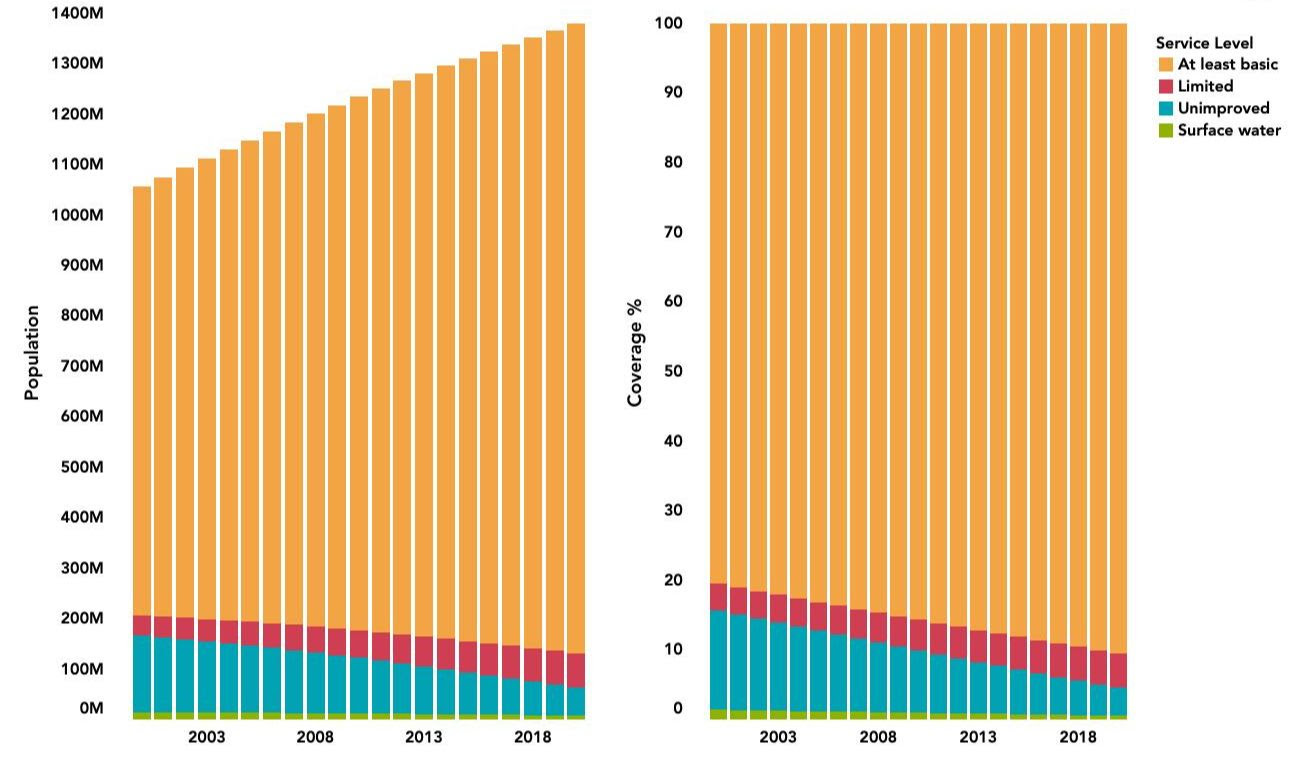 While access to drinking water is a priority, ensuring safe drinking water is also crucial. The UN looks at drinking water on a ladder, with levels for safely managed water, basic water, unimproved, and surface water. In recent years, India has shown steady improvement in access to basic and safely managed drinking water, covering 91% of households in 2018 from 80% in the early 2000s, as per reports from the WHO/UNICEF Joint Monitoring Programme for Water Supply.
Groundwater Exploitation and Contamination
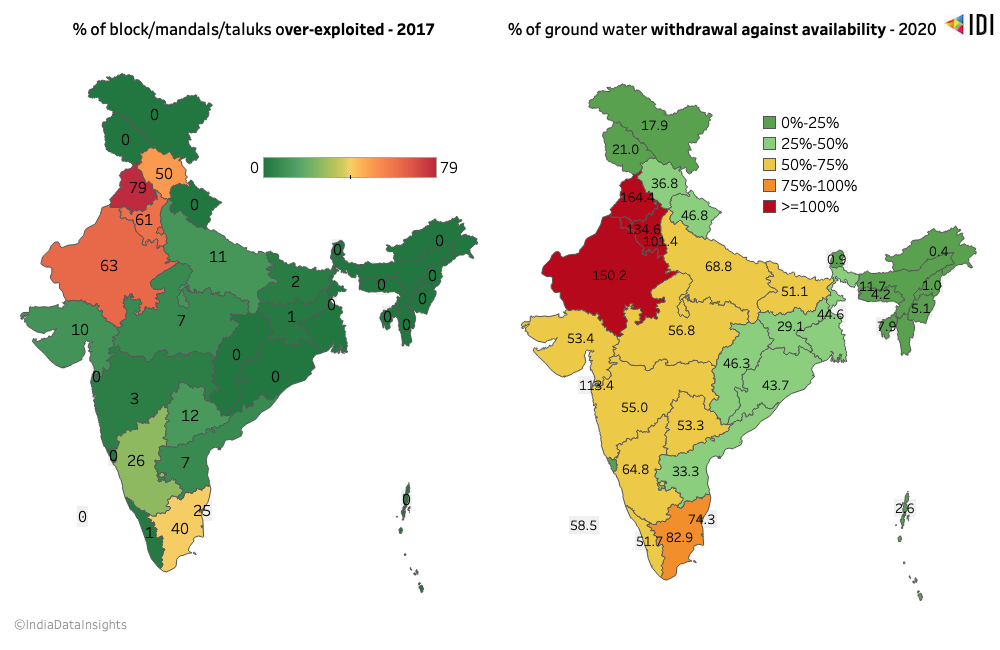
Access to safe drinking water is affected by the availability of groundwater in the region. Groundwater is predominantly over-exploited in the Northwestern belt with ~79% of districts in Punjab over-exploiting the groundwater, followed by Rajasthan and Haryana at 63% and 61%, respectively.
When looking at the percentage of groundwater withdrawal, entire western India shows extremely high groundwater withdrawal against availability, while the North East, in contrast, has well-managed water withdrawal. Over extraction of groundwater is seen highest in the state of Punjab (~164%). These are ominous signs for a primarily agrarian state.
While access to drinking water is a priority, ensuring safe drinking water is also crucial. The UN looks at drinking water on a ladder, with levels for safely managed water, basic water, unimproved, and surface water. In recent years, India has shown steady improvement in access to basic and safely managed drinking water, covering 91% of households in 2018 from 80% in the early 2000s, as per reports from the WHO/UNICEF Joint Monitoring Programme for Water Supply.
Groundwater Exploitation and Contamination
Access to safe drinking water is affected by the availability of groundwater in the region. Groundwater is predominantly over-exploited in the Northwestern belt with ~79% of districts in Punjab over-exploiting the groundwater, followed by Rajasthan and Haryana at 63% and 61%, respectively.
When looking at the percentage of groundwater withdrawal, entire western India shows extremely high groundwater withdrawal against availability, while the North East, in contrast, has well-managed water withdrawal. Over extraction of groundwater is seen highest in the state of Punjab (~164%). These are ominous signs for a primarily agrarian state.
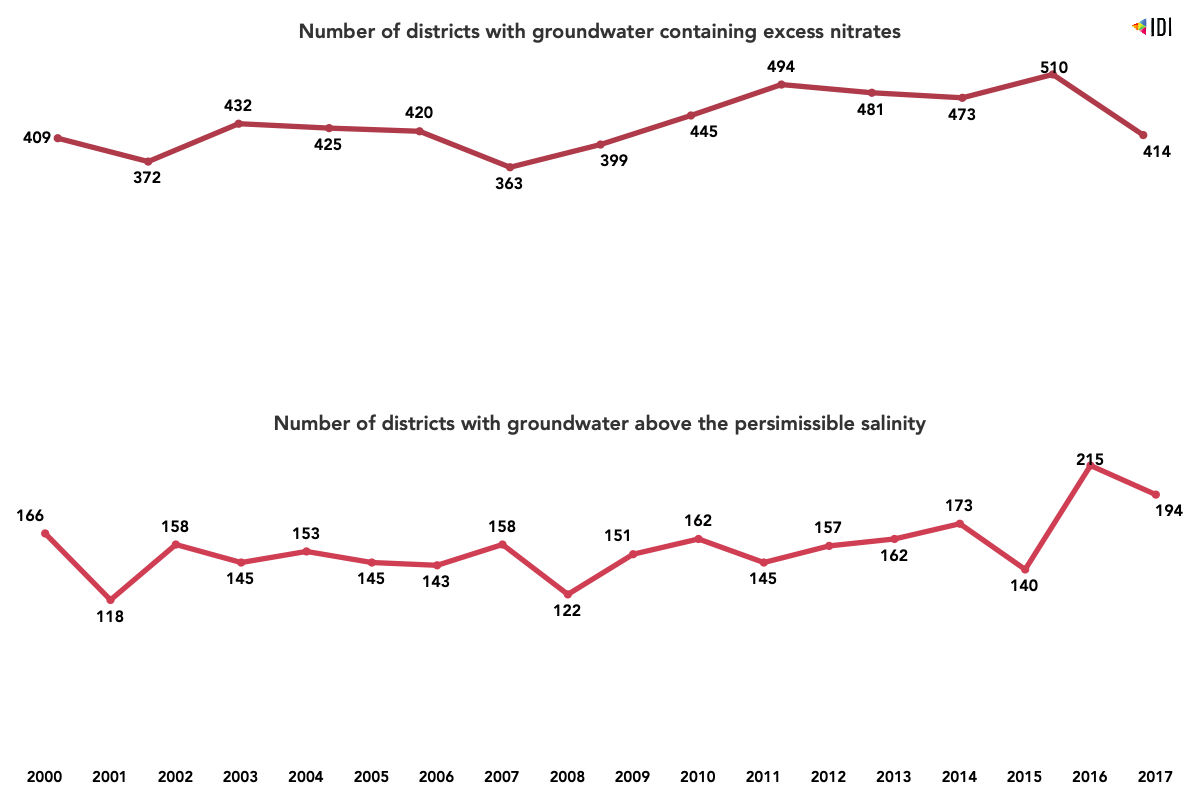
 Numerous factors determine the usability of groundwater, with two predominant factors being water salinity and nitrate content.
High salinity in groundwater results from natural geological phenomena. In India, the number of districts with highly saline water has fluctuated in the last two decades. As per 2017 data, 194 districts had groundwater with salinity above the permissible limit.
In the case of nitrate levels, however, there has been a steady decline. Nitrate contamination is due to activities like mining, disposal of industrial wastes, and untreated domestic wastes. In 2000, 409 districts were identified to have excess nitrates in their groundwater. By 2017, this number was at 414, despite reaching 510 in 2016. Overall, groundwater quality has depleted from 2000 to 2017.
Numerous factors determine the usability of groundwater, with two predominant factors being water salinity and nitrate content.
High salinity in groundwater results from natural geological phenomena. In India, the number of districts with highly saline water has fluctuated in the last two decades. As per 2017 data, 194 districts had groundwater with salinity above the permissible limit.
In the case of nitrate levels, however, there has been a steady decline. Nitrate contamination is due to activities like mining, disposal of industrial wastes, and untreated domestic wastes. In 2000, 409 districts were identified to have excess nitrates in their groundwater. By 2017, this number was at 414, despite reaching 510 in 2016. Overall, groundwater quality has depleted from 2000 to 2017.
 Sanitation
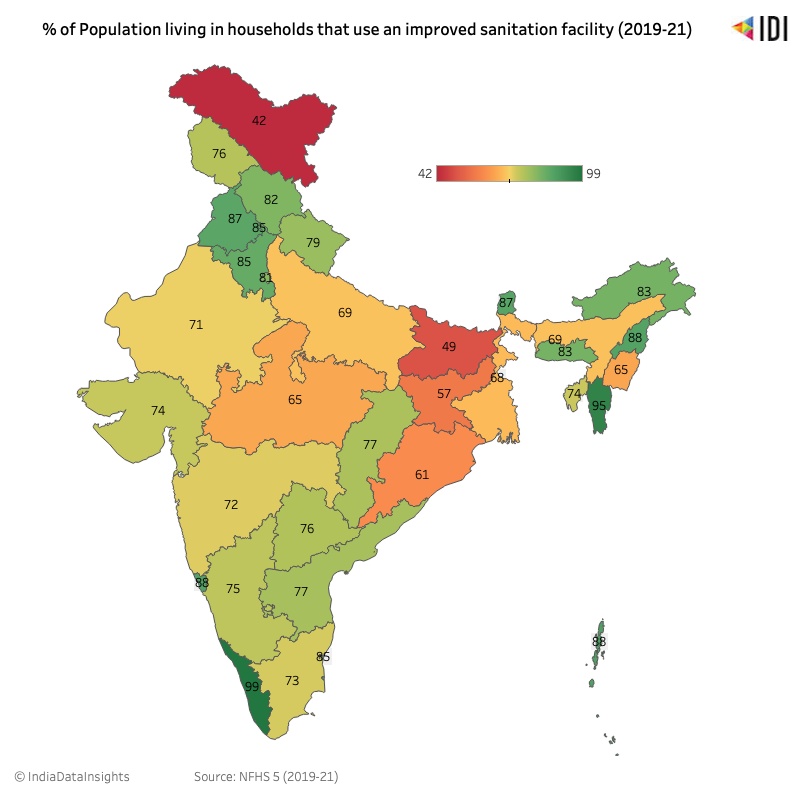
Improved sanitation is a major determining factor in the quality of life and should be ensured to prevent the spread of illness. Improved sanitation includes any non-shared toilet. As per the latest NFHS survey (2019-21), Kerala and Mizoram have the largest percent of improved sanitation facilities at 99% and 95%, respectively. In general, large parts of Southern India fared well, with each state having a rate above 70% which is the highest among the regions.
Sanitation
Improved sanitation is a major determining factor in the quality of life and should be ensured to prevent the spread of illness. Improved sanitation includes any non-shared toilet. As per the latest NFHS survey (2019-21), Kerala and Mizoram have the largest percent of improved sanitation facilities at 99% and 95%, respectively. In general, large parts of Southern India fared well, with each state having a rate above 70% which is the highest among the regions.
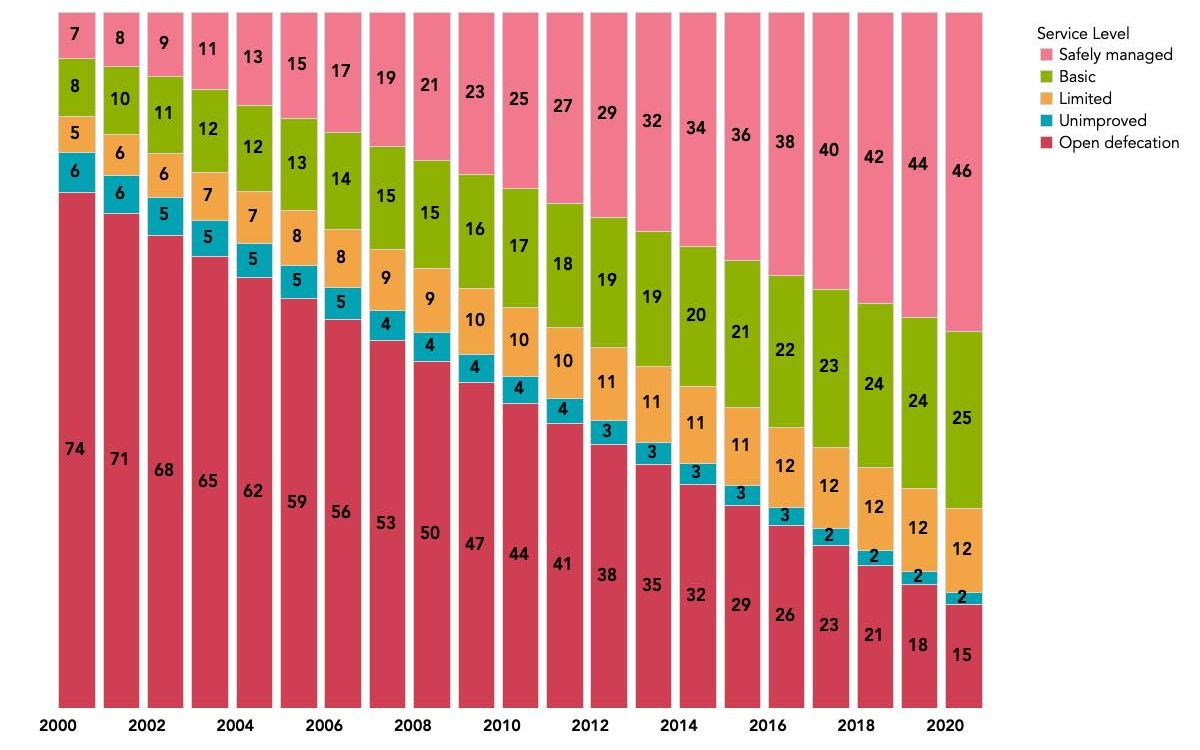
 While there has been an improvement in the availability of sanitation facilities across the nation, it has taken nearly two decades to reach the current status, and that too not without shortcomings. The WHO and UNICEF Joint Monitoring Programme (JMP) assess water supply and sanitation on a ladder scale with five levels - Safely Managed, Basic, Limited, Unimproved, and Open Defecation. Since 2000, the number of safely managed sanitation facilities has increased by 39%, and open defecation has decreased by 59%, which are promising signs.
Access to Safe Sanitation Ladder
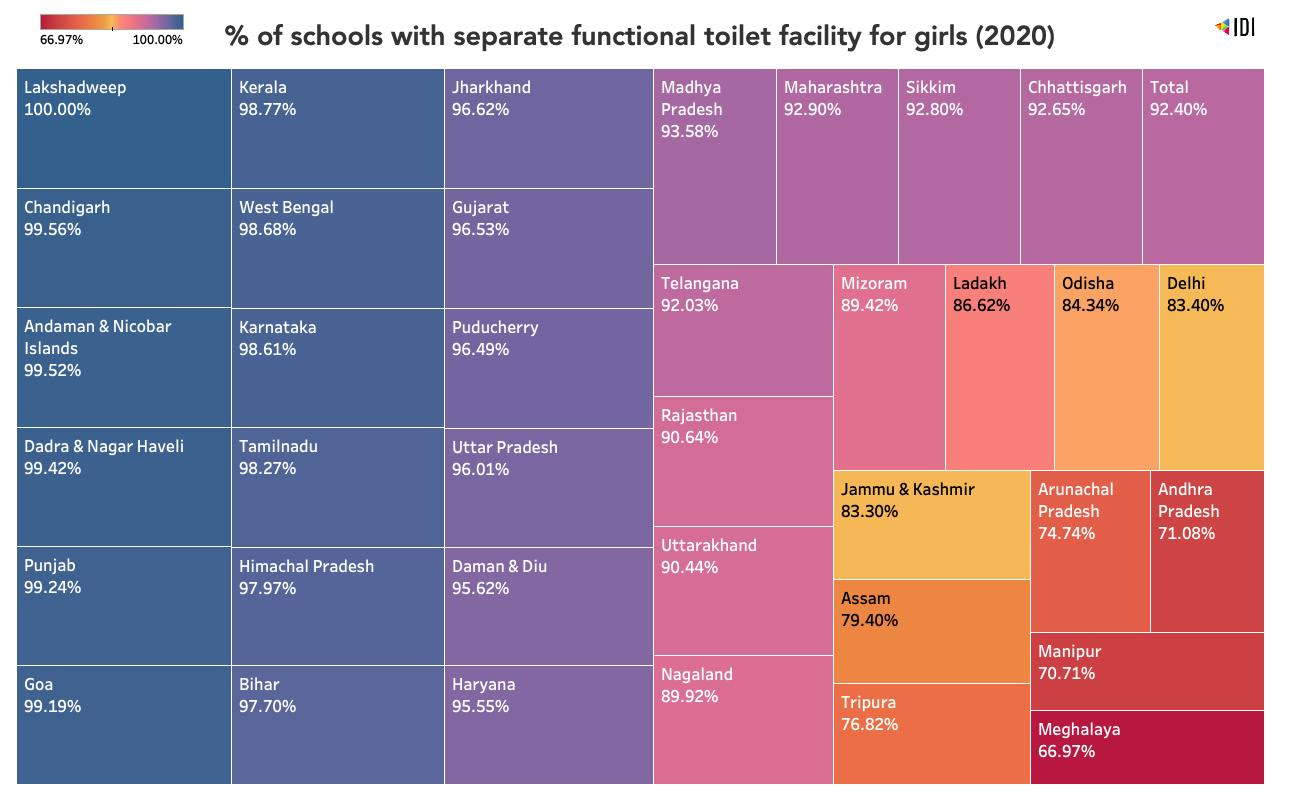
 Other promising signs of improvement in sanitation include the current state of functional toilets for girls in schools. Out of India’s 28 states and 8 Union Territories, only four fall below the 75% mark, with over 90% of schools in 26 states/UTs having functional toilet facilities for girls, with Lakshadeep and Chandigarh leading at 100% and 99.5%, respectively. Manipur and Meghalaya are the worst at 70.71% and 66.97% respectively. In addition, the presence of separate toilets and menstrual hygiene management facilities can help girls stay in school and reduce drop-outs, further reducing the risk of early marriage and pregnancy.
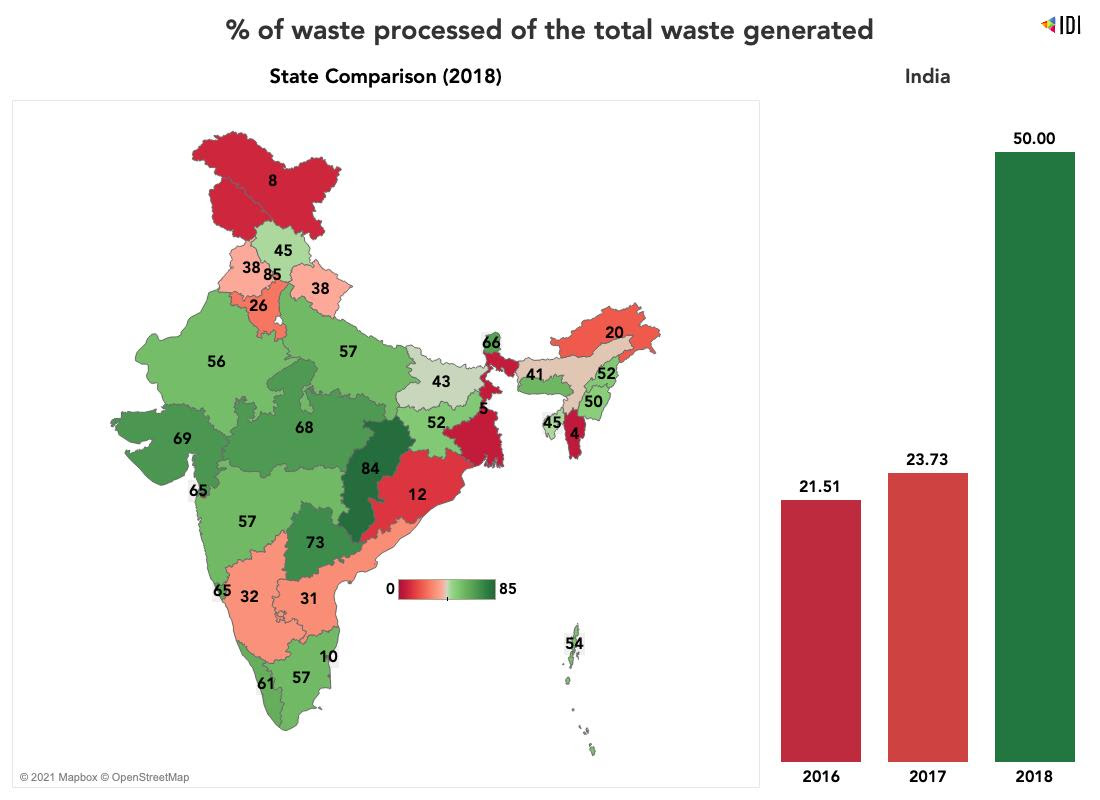
 Similar to sanitation facilities, solid waste management in the country has also seen a drastic improvement from 2016 to 2018. Solid waste management has improved over 100% from 2016 to 2018, and 50% of the solid waste is now processed compared to the 21.5% in 2016. In terms of the percentage of waste processed of the total waste generated, Chattisgarh ranks the highest at 84%, while Mizoram and West Bengal rank the lowest with 4% and 5% respectively.
 Improved toilet facilities, sanitation, waste management, and drinking water facilities contribute towards attaining the clean water and sanitation goal. Towards this effort, the facilities enabled by the union budget play a significant role. The Department of Drinking Water and Sanitation budget grew nearly 10X from 2010 to 2016, from Rs.1,600 crores to Rs.15,343 crores. Thereafter, there has been a drastic decline to Rs.9,994 crores in 2020. The rate of utilization has also reached its lowest in the last decade, dropping to 60%.
 Corporate Contributions
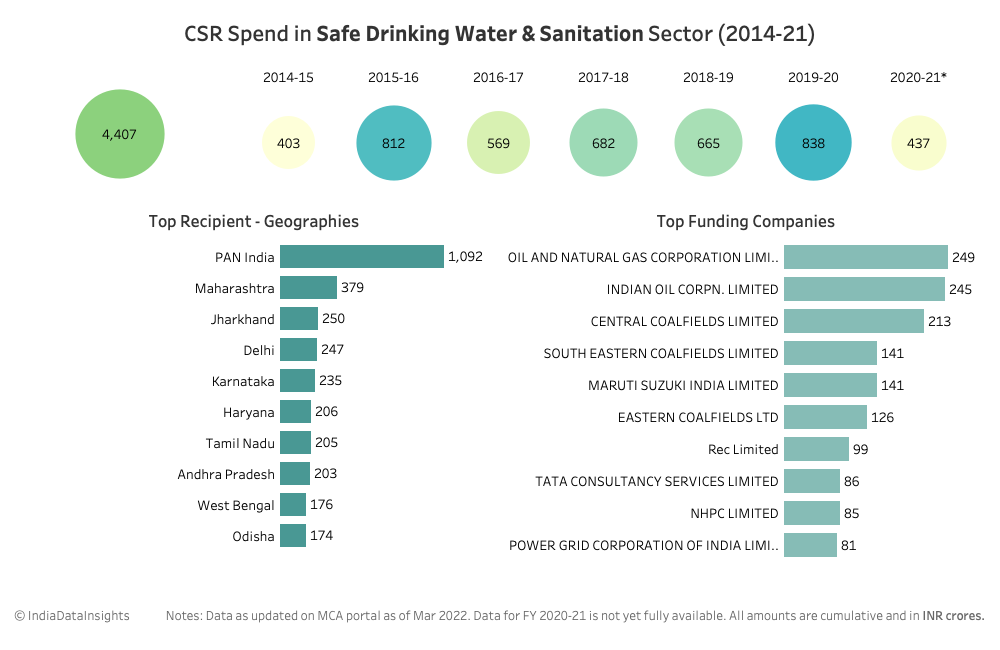
Indian corporates have contributed INR 4,407 Crores to Safe Drinking Water and Sanitation programs since 2014. However the contribution towards clean water and sanitation witnessed a fair bit of fluctuation from 2014 to 2017-18. Post 2018-19 till 2019-20, it showed consistent growth. We see a dip in 2020-21 because the data for FY 2020-21 is not fully available yet.
The sector has showcased 65% increase in the spend over the past 6 years up until 2019-20. ONGC and India Oil contributed to ~11% of the entire CSR spend in the sector. The top 5 corporate contributors in the area of Clean water and Sanitation after ONGC and Indian Oil include Central CoalFields Limited, South Eastern CoalFields Limited, Maruti Suzuki India Limited with a combined investment at ₹989 crore.
Corporate Contributions
Indian corporates have contributed INR 4,407 Crores to Safe Drinking Water and Sanitation programs since 2014. However the contribution towards clean water and sanitation witnessed a fair bit of fluctuation from 2014 to 2017-18. Post 2018-19 till 2019-20, it showed consistent growth. We see a dip in 2020-21 because the data for FY 2020-21 is not fully available yet.
The sector has showcased 65% increase in the spend over the past 6 years up until 2019-20. ONGC and India Oil contributed to ~11% of the entire CSR spend in the sector. The top 5 corporate contributors in the area of Clean water and Sanitation after ONGC and Indian Oil include Central CoalFields Limited, South Eastern CoalFields Limited, Maruti Suzuki India Limited with a combined investment at ₹989 crore.
 For more data assets on SDG 6, click here.